Volvo 2013 Annual Report Download - page 85
Download and view the complete annual report
Please find page 85 of the 2013 Volvo annual report below. You can navigate through the pages in the report by either clicking on the pages listed below, or by using the keyword search tool below to find specific information within the annual report.-
 1
1 -
2
-
3
-
4
-
5
-
6
-
7
-
8
-
9
-
10
-
11
-
12
-
13
-
14
-
15
-
16
-
17
-
18
-
19
-
20
-
21
-
22
-
23
-
24
-
25
-
26
-
27
-
28
-
29
-
30
-
31
-
32
-
33
-
34
-
35
-
36
-
37
-
38
-
39
-
40
-
41
-
42
-
43
-
44
-
45
-
46
-
47
-
48
-
49
-
50
-
51
-
52
-
53
-
54
-
55
-
56
-
57
-
58
-
59
-
60
-
61
-
62
-
63
-
64
-
65
-
66
-
67
-
68
-
69
-
70
-
71
-
72
-
73
-
74
-
 75
75 -
 76
76 -
 77
77 -
 78
78 -
 79
79 -
 80
80 -
 81
81 -
 82
82 -
 83
83 -
 84
84 -
 85
85 -
 86
86 -
 87
87 -
 88
88 -
 89
89 -
 90
90 -
 91
91 -
 92
92 -
 93
93 -
 94
94 -
 95
95 -
96
-
97
-
98
-
99
-
100
-
101
-
102
-
103
-
104
-
105
-
106
-
107
-
108
-
109
-
110
-
111
-
112
-
113
-
114
-
115
-
116
-
117
-
118
-
119
-
120
-
121
-
122
-
123
-
124
-
125
-
126
-
127
-
128
-
129
-
130
-
131
-
132
-
133
-
134
-
135
-
136
-
137
-
138
-
139
-
140
-
141
-
142
-
143
-
144
-
145
-
146
-
147
-
148
-
149
-
150
-
151
-
152
-
153
-
154
-
155
-
156
-
157
-
158
-
159
-
160
-
161
-
162
-
163
-
164
-
165
-
166
-
167
-
168
-
169
-
170
-
171
-
172
-
173
-
174
-
175
-
176
-
177
-
178
-
179
-
180
-
181
-
182
-
183
-
184
-
185
-
186
-
187
-
188
-
189
-
190
-
191
-
192
-
193
-
194
-
195
-
196
-
197
-
198
 |
 |

The fi nancial services of VFS are offered
with the sales of Volvo Group vehicles and
equipment and are available with service agree-
ments and aftermarket services through seam-
less integration at the point-of-sale with Volvo
Group dealers. This approach delivers a con-
venient one stop-shopping experience for the
customer.
Solid profi tability
In 2013, VFS provided fi nancial services in 40
markets around the globe. The global diversifi -
cation of the VFS portfolio proved to be a signif-
icant strength as assets under management
reached all-time highs. This profi table growth
along with stable portfolio performance, increased
operational effi ciency and good funding levels
yielded solid profi tability for VFS in 2013.
Operational consolidation, process standard-
ization and systems harmonization were key
activities during 2013. These activities allowed
VFS to capitalize on profi table growth opportu-
nities with scalable business platforms and high
service levels.
Portfolio development
Overall economic conditions continued to
improve during 2013 and demand for VFS prod-
ucts remained strong even though some mar-
kets struggled for growth.
In the Americas, record managed assets and
retail volumes were achieved and the portfolio
performed extremely well in terms of delinquen-
cies and write-offs.
EMEA (Europe, Middle East and Africa)
achieved a stable portfolio performance but
new volumes were impacted by the relatively
slow demand in truck and construction equip-
ment markets.
In APAC (Asia Pacifi c), profi tability remained
good despite delinquencies in China remaining
on elevated levels.
In all VFS markets, and particularly in devel-
oping markets, downturn preparedness is a key
objective regardless of the current business
cycle.
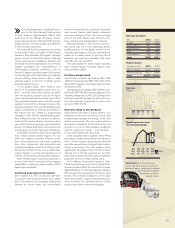
Customer fi nance operations
Total new fi nancing volume in 2013 amounted
to SEK 47.0 billion (46.6). Adjusted for changes
in exchange rates, new business volume increased
by 5.9% compared to 2012. In total, 51,466 new
Volvo Group vehicles and machines (50,994)
were fi nanced during the year. In the markets
where fi nancing is offered, the average penetra-
tion rate was 27% (27).
As of December 31, 2013, the net credit
portfolio amounted to SEK 103,873 M (99,690).
The funding of the credit portfolio is matched in
terms of maturity, interest rates and currencies
in accordance with Volvo Group policy. For further
information see note 4 to the Consolidated
fi nancial statements.
The operating income for the year amounted
to SEK 1,522 M compared to SEK 1,496 M in the
previous year. Return on shareholders’ equity was
12.1% (12.5). The equity ratio at the end of the
year was 8.1% (8.1). Improvements in gross in -
come and operating expenses were partially off-
set by higher credit provisions.
During the year, credit provision expenses
amounted to SEK 923 M (639) while write-offs
of SEK 719 M (577) were recorded. Third quarter
provisions and write-offs were higher than nor-
mal due to deterioration of collateral positions
and values related to non-performing loans and
leases in Spain stemming from the global fi nan-
cial crisis in 2009 and 2010 caused by the con-
tinuing recession and protracted legal pro-
cesses in that country. The write-off ratio for
2013 was 0.71% (0.58). At the end of Decem-
ber 31, 2013, credit reserves were 1.31% (1.23)
of the credit portfolio.
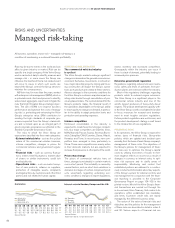
Operating income (loss)
SEK M
Return on shareholders’ equity
%
Penetration rate1, %
3030
Volvo
Trucks
Renault
Trucks
Mack
Trucks
Buses Volvo
CE
UD
Trucks
2123 2119 1621 3637 1213
12 13
1 Share of unit sales fi nanced
by Volvo Financial Services in
relation to total number units
sold by the Volvo Group in
markets where fi nancial ser-
vices are offered.
13
1,522
12
1,496
11
969
10
167
09
(680)
1,522
13
12.5 12.1
12
12.1
Distribution of credit portfolio
Volvo Trucks 45%
Volvo CE 28%
Renault Trucks 11%
Mack Trucks 9%
Buses 5%
UD Trucks 2%
81