Volvo 2013 Annual Report Download - page 117
Download and view the complete annual report
Please find page 117 of the 2013 Volvo annual report below. You can navigate through the pages in the report by either clicking on the pages listed below, or by using the keyword search tool below to find specific information within the annual report.-
 1
1 -
2
-
3
-
4
-
5
-
6
-
7
-
8
-
9
-
10
-
11
-
12
-
13
-
14
-
15
-
16
-
17
-
18
-
19
-
20
-
21
-
22
-
23
-
24
-
25
-
26
-
27
-
28
-
29
-
30
-
31
-
32
-
33
-
34
-
35
-
36
-
37
-
38
-
39
-
40
-
41
-
42
-
43
-
44
-
45
-
46
-
47
-
48
-
49
-
50
-
51
-
52
-
53
-
54
-
55
-
56
-
57
-
58
-
59
-
60
-
61
-
62
-
63
-
64
-
65
-
66
-
67
-
68
-
69
-
70
-
71
-
72
-
73
-
74
-
75
-
76
-
77
-
78
-
79
-
80
-
81
-
82
-
83
-
84
-
85
-
86
-
87
-
88
-
89
-
90
-
91
-
92
-
93
-
94
-
95
-
96
-
97
-
98
-
99
-
100
-
101
-
102
-
103
-
104
-
105
-
106
-
 107
107 -
 108
108 -
 109
109 -
 110
110 -
 111
111 -
 112
112 -
 113
113 -
 114
114 -
 115
115 -
 116
116 -
 117
117 -
 118
118 -
 119
119 -
 120
120 -
 121
121 -
 122
122 -
 123
123 -
 124
124 -
 125
125 -
 126
126 -
 127
127 -
128
-
129
-
130
-
131
-
132
-
133
-
134
-
135
-
136
-
137
-
138
-
139
-
140
-
141
-
142
-
143
-
144
-
145
-
146
-
147
-
148
-
149
-
150
-
151
-
152
-
153
-
154
-
155
-
156
-
157
-
158
-
159
-
160
-
161
-
162
-
163
-
164
-
165
-
166
-
167
-
168
-
169
-
170
-
171
-
172
-
173
-
174
-
175
-
176
-
177
-
178
-
179
-
180
-
181
-
182
-
183
-
184
-
185
-
186
-
187
-
188
-
189
-
190
-
191
-
192
-
193
-
194
-
195
-
196
-
197
-
198
 |
 |
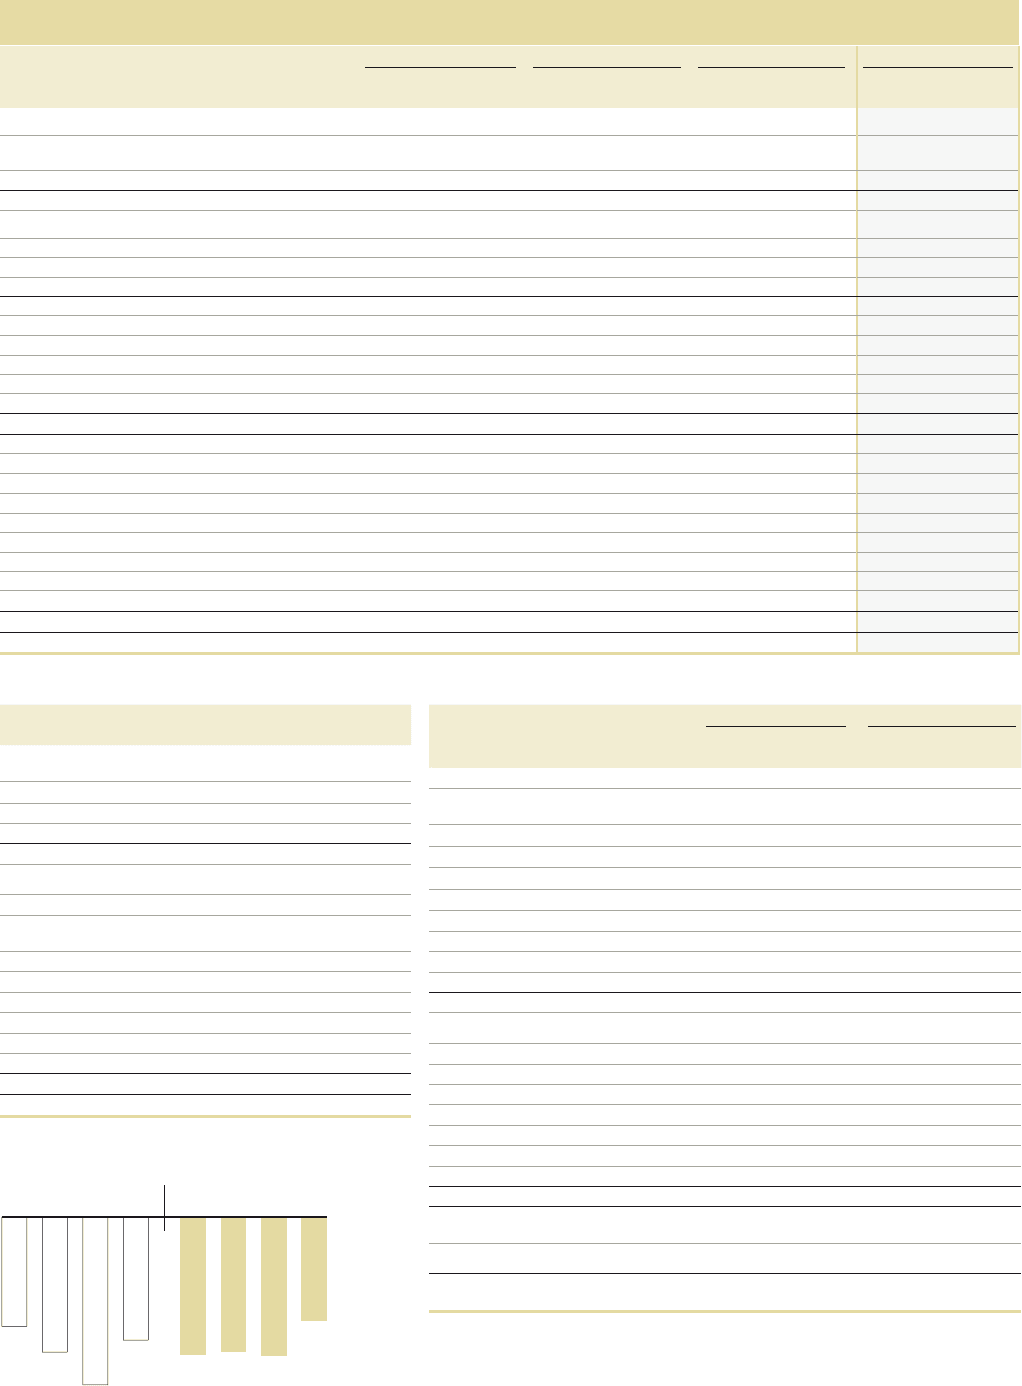
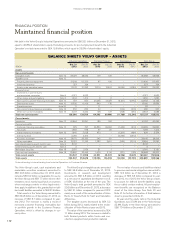
Net fi nancial position, SEK M Industrial Operations Volvo Group
Dec 31
2013 Dec 31
2012 Dec 31
2013 Dec 31
2012
Non-currentinterest-bearing assets
Non-current customer-fi nancing
receivables – – 43,792 41,156
Non-current interest-bearing receivables 550 653 480 337
Currentinterest-bearing assets
Customer-fi nancing receivables – – 40,069 39,833
Interest-bearing receivables 1,645 3,038 909 2,574
Internal funding 2,256 4,612 – –
Interest-bearing assets held for sale 2 – 2 –
Marketable securities 2,570 3,129 2,591 3,130
Cash and bank 25,660 23,465 26,968 25,207
Total fi nancial assets 32,683 34,897 114,811 112,237
Non-currentinterest-bearing liabilities
Bond loans (46,585) (43,092) (46,585) (43,092)
Other loans (31,219) (33,351) (36,864) (38,428)
Internal funding 34,027 33,990 ––
Currentinterest-bearing liabilities
Loans (46,806) (45,456) (51,552) (50,013)
Internal funding 38,090 33,745 ––
Interest-bearing liabilities held for sale (18) – (18) –
Total fi nancial liabilities (52,511) (54,163) (135,019) (131,534)
Net fi nancial position excl. post-
employment benefi ts (19,828) (19,266) (20,208) (19,297)
Provision for post-employment benefi ts, net (12,238) (18,772) (12,300) (18,835)
Net fi nancial position incl.
post- employment benefi ts (32,066) (38,038) (32,508) (38,131)
Net debt, Industrial Operations, SEK bn
2012 2013
Q4
(32.1)
Q3
(42.8)
Q2
(41.5)
Q1
(42.7)
Q4
(38.0)
Q3
(51.9)
Q2
(41.7)
Q1
(33.8)
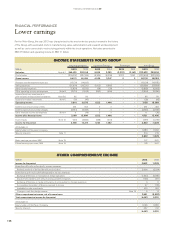
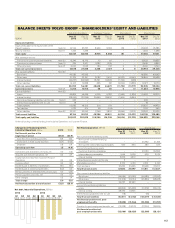
BALANCE SHEETS VOLVO GROUP – SHAREHOLDERS’ EQUITY AND LIABILITIES
Industrial Operations Customer Finance Eliminations Volvo Group
SEK M Dec 31
2013 Dec 31
2012 Dec 31
2013 Dec 31
2012 Dec 31
2013 Dec 31
2012 Dec 31
2013 Dec 31
2012
Equity and liabilities
Equity attributable to the equity holder of the
Parent Company Note 19 67,134 67,227 8,906 8,558 (8) – 76,032 75,785
Minority interests Note 11 1,333 1,266 – – – – 1,333 1,266
Total equity 68,467 68,493 8,906 8,558 (8) – 77,365 77,051
Non-current provisions
Provisions for post-employment benefi ts Note 20 12,249 18,772 73 63 – – 12,322 18,835
Provisions for deferred taxes Note 10 324 2,971 2,082 1,879 – – 2,406 4,850
Other provisions Note 21 6,005 5,545 183 187 2 8 6,190 5,740
Total non-current provisions 18,578 27,288 2,338 2,129 2 8 20,918 29,425
Non-current liabilities Note 22
Bond loans 46,585 43,092 – – – – 46,585 43,092
Other loans 31,219 33,351 12,182 11,630 (6,537) (6,553) 36,864 38,428
Internal funding1 (34,027) (33,990) 35,761 34,298 (1,734) (308) – –
Other liabilities 14,315 13,828 665 742 (3,503) (3,856) 11,477 10,714
Total non-current liabilities 58,092 56,281 48,608 46,670 (11,774) (10,717) 94,926 92,234
Current provisions Note 21 11, 24 6 10, 916 58 5 0 0 10 11, 30 4 10 ,976
Current liabilities Note 22
Loans 46,806 45,456 6,705 6,393 (1,959) (1,836) 51,552 50,013
Internal funding1 (38,090) (33,746) 39,659 38,600 (1,569) (4,854) – –
Non interest-bearing liabilities held for sale Note 3 332 – – – – – 332 –
Interest-bearing liabilities held for sale Note 3 18 – – – – – 18 –
Trade payables 53,685 46,313 216 159 – – 53,901 46,472
Tax liabilities 1,072 614 48 (154) – – 1,120 460
Other liabilities Note 22 33,331 32,063 2,758 3,803 (2,696) (3,331) 33,393 32,535
Total current liabilities 97,154 90,700 49,386 48,801 (6,224) (10,021) 140,316 129,480
Total equity and liabilities 253,537 253,678 109,296 106,208 (18,004) (20,720) 344,829 339,166
1 Internal funding is internal lending from Industrial Operations to Customer Finance.
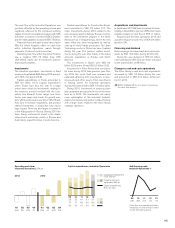
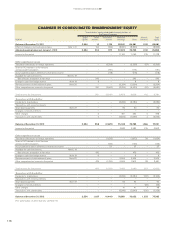
Change in net fi nancial position,
Industrial Operations, SEK bn 2013 2012
Net fi nancial position at the
beginning of period (38.0) (32.9)
Cash fl ow from operating activities 14.6 12.4
Investments in fi xed assets (to)/from (13.7) (18.2)
Disposals 0.6 0.9
Operating cash-fl ow 1.5 (4.9)
Investments and divestments of shares, net 0.0 (1.2)
Acquired and divested operations, net 0.4 3.7
Capital injections (to)/from Customer Finance
Operations 0.4 0.9
Currency effect 3.4 3.6
Dividend paidto AB Volvo shareholders (6.1) (6.1)
Dividend paid to minority shareholders (0.2) 0.0
Remeasurements of defi ned benefi t pension plans 6.0 (2.5)
Pension payments and costs, net 0.3 0.0
Other changes 0.2 1.4
Total change 5.9 (5.1)
Net fi nancial position at end of period (32.1) (38.0)
113113