Volvo 2013 Annual Report Download - page 120
Download and view the complete annual report
Please find page 120 of the 2013 Volvo annual report below. You can navigate through the pages in the report by either clicking on the pages listed below, or by using the keyword search tool below to find specific information within the annual report.-
 1
1 -
2
-
3
-
4
-
5
-
6
-
7
-
8
-
9
-
10
-
11
-
12
-
13
-
14
-
15
-
16
-
17
-
18
-
19
-
20
-
21
-
22
-
23
-
24
-
25
-
26
-
27
-
28
-
29
-
30
-
31
-
32
-
33
-
34
-
35
-
36
-
37
-
38
-
39
-
40
-
41
-
42
-
43
-
44
-
45
-
46
-
47
-
48
-
49
-
50
-
51
-
52
-
53
-
54
-
55
-
56
-
57
-
58
-
59
-
60
-
61
-
62
-
63
-
64
-
65
-
66
-
67
-
68
-
69
-
70
-
71
-
72
-
73
-
74
-
75
-
76
-
77
-
78
-
79
-
80
-
81
-
82
-
83
-
84
-
85
-
86
-
87
-
88
-
89
-
90
-
91
-
92
-
93
-
94
-
95
-
96
-
97
-
98
-
99
-
100
-
101
-
102
-
103
-
104
-
105
-
106
-
107
-
108
-
109
-
 110
110 -
 111
111 -
 112
112 -
 113
113 -
 114
114 -
 115
115 -
 116
116 -
 117
117 -
 118
118 -
 119
119 -
 120
120 -
 121
121 -
 122
122 -
 123
123 -
 124
124 -
 125
125 -
 126
126 -
 127
127 -
 128
128 -
 129
129 -
 130
130 -
131
-
132
-
133
-
134
-
135
-
136
-
137
-
138
-
139
-
140
-
141
-
142
-
143
-
144
-
145
-
146
-
147
-
148
-
149
-
150
-
151
-
152
-
153
-
154
-
155
-
156
-
157
-
158
-
159
-
160
-
161
-
162
-
163
-
164
-
165
-
166
-
167
-
168
-
169
-
170
-
171
-
172
-
173
-
174
-
175
-
176
-
177
-
178
-
179
-
180
-
181
-
182
-
183
-
184
-
185
-
186
-
187
-
188
-
189
-
190
-
191
-
192
-
193
-
194
-
195
-
196
-
197
-
198
 |
 |

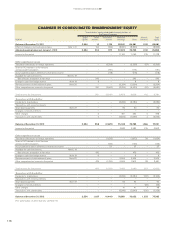
CHANGES IN CONSOLIDATED SHAREHOLDERS’ EQUITY
Shareholders’ equity attributable to equity holders of
the Parent Company
SEK M Share
capital Other
reserves1Translation
reserve Retained
earnings Total Minority
interests Total
equity
Balance at December 31, 2011 2,554 10 1,176 80,841 84,581 1,100 85,681
Effect of changes in accounting principles Note 1, 31 – 194 (199) (8,821) (8,826) – (8,826)
Adjusted opening balance at January 1, 2012 2,554 204 977 72,020 75,755 1,100 76,855
Income for the period – – – 11,160 11,160 219 11,378
Other comprehensive income
Translation differences on foreign operations – – (3,338) – (3,338) (57) (3,395)
Share of OCI related to Joint Ventures
and associated companies – – (191) – (191) – (191)
Accumulated translation differences reversed to income – – (118) – (118) – (118)
Available-for-sale investments: Note 5, 19
Gains/losses at valuation to fair value – 343 – – 343 – 343
Change incash fl ow hedge reserve Note 19 – 8 – – 8 – 8
Remeasurements of defi ned benefi t plans Note 20 – – – (2,234) (2,234) – (2,234)
Other comprehensive income for the period – 351 (3,647) (2,234) (5,530) (57) (5,587)
Total income for the period – 351 (3,647) 8,925 5,629 162 5,791
Transactions with shareholders
Dividends to shareholders – – – (6,083) (6,083) – (6,083)
Transactions with minority interests –– – ––––
Share based payments Note 27 – – – 90 90 – 90
Changes in minority interests –– – ––––
Other changes – 3 – 391 394 4 398
Transactions with shareholders – 3 – (5,602) (5,599) 4 (5,595)
Balance at December 31, 2012 2,554 558 (2,670) 75,343 75,785 1,266 77,051
Income for the period – – – 3,583 3,583 219 3,802
Other comprehensive income
Translation differences on foreign operations – – (1,672) – (1,672) 38 (1,634)
Share of OCI related to Joint Ventures
and associated companies – – (135) – (135) – (135)
Accumulated translation differences reversed to income – – 37 – 37 – 37
Available-for-sale investments: Note 5, 19
Gains/losses at valuation to fair value – 470 – – 470 – 470
Change incash fl ow hedge reserve Note 19 – 9 – – 9 – 9
Remeasurements of defi ned benefi t plans Note 20 – – – 3,904 3,904 – 3,904
Other comprehensive income for the period – 479 (1,770) 3,904 2,613 38 2,651
Total income for the period – 479 (1,770) 7,487 6,196 257 6,453
Transactions with shareholders
Dividends to shareholders – – – (6,084) (6,084) (162) (6,246)
Transactions with minority interests – – – – – – –
Share based payments Note 27 – – – 94 94 – 94
Changes in minority interests – – – – – (35) (35)
Other changes – – – 41 41 7 48
Transactions with shareholders – – – (5,949) (5,949) (190) (6,139)
Balance at December 31, 2013 2,554 1,037 (4,440) 76,881 76,032 1,333 77,365
1 For specifi cation of other reserves, see Note 19.
116
FINANCIAL INFORMATION 2013
116