Volvo 2013 Annual Report Download - page 116
Download and view the complete annual report
Please find page 116 of the 2013 Volvo annual report below. You can navigate through the pages in the report by either clicking on the pages listed below, or by using the keyword search tool below to find specific information within the annual report.-
 1
1 -
2
-
3
-
4
-
5
-
6
-
7
-
8
-
9
-
10
-
11
-
12
-
13
-
14
-
15
-
16
-
17
-
18
-
19
-
20
-
21
-
22
-
23
-
24
-
25
-
26
-
27
-
28
-
29
-
30
-
31
-
32
-
33
-
34
-
35
-
36
-
37
-
38
-
39
-
40
-
41
-
42
-
43
-
44
-
45
-
46
-
47
-
48
-
49
-
50
-
51
-
52
-
53
-
54
-
55
-
56
-
57
-
58
-
59
-
60
-
61
-
62
-
63
-
64
-
65
-
66
-
67
-
68
-
69
-
70
-
71
-
72
-
73
-
74
-
75
-
76
-
77
-
78
-
79
-
80
-
81
-
82
-
83
-
84
-
85
-
86
-
87
-
88
-
89
-
90
-
91
-
92
-
93
-
94
-
95
-
96
-
97
-
98
-
99
-
100
-
101
-
102
-
103
-
104
-
105
-
 106
106 -
 107
107 -
 108
108 -
 109
109 -
 110
110 -
 111
111 -
 112
112 -
 113
113 -
 114
114 -
 115
115 -
 116
116 -
 117
117 -
 118
118 -
 119
119 -
 120
120 -
 121
121 -
 122
122 -
 123
123 -
 124
124 -
 125
125 -
 126
126 -
127
-
128
-
129
-
130
-
131
-
132
-
133
-
134
-
135
-
136
-
137
-
138
-
139
-
140
-
141
-
142
-
143
-
144
-
145
-
146
-
147
-
148
-
149
-
150
-
151
-
152
-
153
-
154
-
155
-
156
-
157
-
158
-
159
-
160
-
161
-
162
-
163
-
164
-
165
-
166
-
167
-
168
-
169
-
170
-
171
-
172
-
173
-
174
-
175
-
176
-
177
-
178
-
179
-
180
-
181
-
182
-
183
-
184
-
185
-
186
-
187
-
188
-
189
-
190
-
191
-
192
-
193
-
194
-
195
-
196
-
197
-
198
 |
 |

The Volvo Group’s cash, cash equivalents and
marketable securities combined, amounted to
SEK 29.6 billion at December 31, 2013 which
includes SEK 0.2 billion not available for use by
the Volvo Group and SEK 7.7 billion where other
limitations exist, mainly liquid funds in countries
where exchange controls or other legal restric-
tions apply. In addition to this, granted but not util-
ized credit facilities amounted to SEK 31.9 billion.
Total assets in the Volvo Group amounted to
SEK 344.8 billion as of December 31, 2013, an
increase of SEK 5.7 billion compared to year-
end 2012. The increase is mainly a result of
in creased customer fi nancing receivables due
to portfolio growth in the Customer Finance
Operations which is offset by changes in cur-
rency rates.
Net debt in the Volvo Group’s Industrial Operations amounted to SEK 32.1 billion at December 31, 2013,
equal to 46.8% of shareholders’ equity. Excluding provisions for post-employment benefi ts the Industrial
Operation’s net debt amounted to SEK 19.8 billion, which equal to 29.0% of shareholders’ equity.
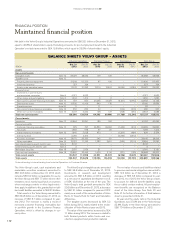
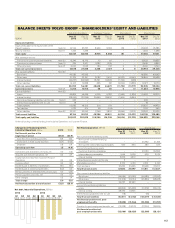
FINANCIAL POSITION
Maintained fi nancial position
BALANCE SHEETS VOLVO GROUP – ASSETS
Industrial Operations Customer Finance Eliminations Volvo Group
SEK M
Dec 31
2013 Dec 31
2012
Dec 31
2013 Dec 31
2012
Dec 31
2013 Dec 31
2012
Dec 31
2013 Dec 31
2012
Assets
Non-current assets
Intangible assets Note 12 36,479 38,592 109 106 – – 36,588 38,698
Tangible assets Note 13
Property, plant and equipment 51,819 53,330 87 105 – – 51,906 53,435
Investment property 327 754 – – – – 327 754
Assets under operating leases 17,013 21,263 13,714 12,543 (5,055) (4,784) 25,672 29,022
Financial assets
Investments in joint ventures
and associated companies Note 5 4,377 4,523 – – – – 4,377 4,523
Other shares and participations Note 5 1,944 1,614 6 6 – – 1,950 1,620
Non-current customer-fi nancing receivables Note 15 727 600 49,466 47,329 (6,401) (6,773) 43,792 41,156
Deferred tax assets Note 10 12,326 15,106 840 770 – – 13,166 15,876
Prepaid pensions Note 20 11 – 11 – – – 22 –
Non-current interest-bearing receivables Note 16 550 653 34 – (104) (316) 480 337
Other non-current receivables Note 16 3,017 3,334 128 127 (208) (373) 2,937 3,088
Total non-current assets 128,590 139,769 64,395 60,986 (11,768) (12,246) 181,217 188,510
Current assets
Inventories Note 17 40,964 39,741 189 352 – – 41,153 40,093
Current receivables
Customer-fi nancing receivables Note 15 679 797 40,854 39,946 (1,464) (910) 40,069 39,833
Tax assets 1,692 978 57 35 – – 1,749 1,013
Interest-bearing receivables Note 16 1,645 3,038 473 – (1,209) (464) 909 2,574
Internal funding12,2564,612––(2,256)(4,612)––
Accounts receivable Note 16 29,170 26,395 245 121 – – 29,415 26,516
Other receivables Note 16 12,207 11,753 1,383 2,651 (936) (2,114) 12,654 12,290
Non interest-bearing assets held for sale Note 3 8,102 – – – – – 8,102 –
Interest-bearing assets held for sale Note 3 2 – – – – – 2 –
Marketable securities Note 18 2,570 3,129 21 1 – – 2,591 3,130
Cash and cash equivalents Note 18 25,660 23,465 1,679 2,116 (371) (374) 26,968 25,207
Total current assets 124,947 113,908 44,901 45,222 (6,236) (8,474) 163,612 150,656
Total assets 253,537 253,678 109,296 106,208 (18,004) (20,720) 344,829 339,166
1 Internal funding is internal lending from Industrial Operations to Customer Finance.
The Volvo Group’s intangible assets amounted
to SEK 36.6 billion as of December 31, 2013.
Investments in research and development
amounted to SEK 3.8 billion in 2013, resulting
in a net value of capitalized development costs
of SEK 13.8 billion at the end of the year. The
Volvo Group’s total goodwill amounted to SEK
20.0 billion as of December 31, 2013, a decrease
by SEK 2.1 billion compared to year-end 2012
mainly as a result of the reclassifi cation of Volvo
Rents to “Assets Held for Sale” and translation
differences.
The tangible assets decreased by SEK 5.3
billion during 2013, mainly related to the reclas-
sifi cation of Volvo Rents at year end 2013.
The value of the inventories increased by SEK
1.1 billion during 2013. The increase is related to
both fi nished products within trucks and con-
struction equipment and production material.
The net value of assets and liabilities related
to pensions and similar obligations amounted to
SEK 12.3 billion as of December 31, 2013, a
decrease of SEK 6.5 billion compared to year-
end 2012. As of 2013 the Volvo Group ceases
to account for defi ned benefi t liabilities using
the so called corridor method. All post-employ-
ment benefi ts are recognized on the Balance
sheet of the Volvo Group. See Note 20 and
Note 31 for further information. A third balance
sheet is presented in Note 31.
At year-end, the equity ratio in the Industrial
Operations was 27.0% and in the Volvo Group
22.4%. Equity in the Volvo Group amounted to
SEK 77.4 billion at December 31, 2013.
112
FINANCIAL INFORMATION 2013
112