Volvo 2013 Annual Report Download - page 129
Download and view the complete annual report
Please find page 129 of the 2013 Volvo annual report below. You can navigate through the pages in the report by either clicking on the pages listed below, or by using the keyword search tool below to find specific information within the annual report.-
 1
1 -
2
-
3
-
4
-
5
-
6
-
7
-
8
-
9
-
10
-
11
-
12
-
13
-
14
-
15
-
16
-
17
-
18
-
19
-
20
-
21
-
22
-
23
-
24
-
25
-
26
-
27
-
28
-
29
-
30
-
31
-
32
-
33
-
34
-
35
-
36
-
37
-
38
-
39
-
40
-
41
-
42
-
43
-
44
-
45
-
46
-
47
-
48
-
49
-
50
-
51
-
52
-
53
-
54
-
55
-
56
-
57
-
58
-
59
-
60
-
61
-
62
-
63
-
64
-
65
-
66
-
67
-
68
-
69
-
70
-
71
-
72
-
73
-
74
-
75
-
76
-
77
-
78
-
79
-
80
-
81
-
82
-
83
-
84
-
85
-
86
-
87
-
88
-
89
-
90
-
91
-
92
-
93
-
94
-
95
-
96
-
97
-
98
-
99
-
100
-
101
-
102
-
103
-
104
-
105
-
106
-
107
-
108
-
109
-
110
-
111
-
112
-
113
-
114
-
115
-
116
-
117
-
118
-
 119
119 -
 120
120 -
 121
121 -
 122
122 -
 123
123 -
 124
124 -
 125
125 -
 126
126 -
 127
127 -
 128
128 -
 129
129 -
 130
130 -
 131
131 -
 132
132 -
 133
133 -
 134
134 -
 135
135 -
 136
136 -
 137
137 -
 138
138 -
 139
139 -
140
-
141
-
142
-
143
-
144
-
145
-
146
-
147
-
148
-
149
-
150
-
151
-
152
-
153
-
154
-
155
-
156
-
157
-
158
-
159
-
160
-
161
-
162
-
163
-
164
-
165
-
166
-
167
-
168
-
169
-
170
-
171
-
172
-
173
-
174
-
175
-
176
-
177
-
178
-
179
-
180
-
181
-
182
-
183
-
184
-
185
-
186
-
187
-
188
-
189
-
190
-
191
-
192
-
193
-
194
-
195
-
196
-
197
-
198
 |
 |

G
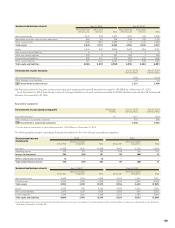
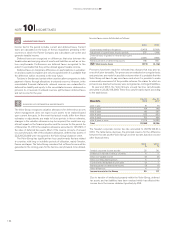
Sensitivity analysis*
Currency effect on net sales from infl ows in foreign currency and translation effect when
consolidating net sales in foreign subsidiares for Industrial operations (G).
Changes in currency exchange rates compared to 2012 (Total SEK neg 15.8 bn)
Appreciation of SEK by 10% (Total SEK neg 25.1 bn) in relation to other currencies
0
(1)
(3)
(2)
(4)
(5)
(6)
(7) BRLAUD CAD EUR INR JPY RUB USD ZAR OtherGBP
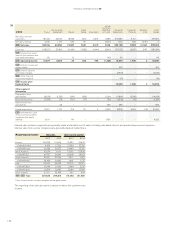
Currency impact on operating income, SEK billion, Industrial Operations 2013 2012 Change
Net fl ows in foreign currency (2.7)
Realizedgains and losses onhedging contracts – – –
Unrealizedgains and lossesonhedging contracts – – –
Unrealizedgains and lossesonreceivables andliabilities in foreign currency (0.3) (0.3) –
Translation effect on operating income in foreign subsidiaries (0.7)
Total currency impact on operating income (3.4)
Currency impact onNet fl ows in foreign currency and Translationeffect on operating income in foreign subsidiaries are detailed in table
Hin key currencies.
The Volvo Group’s currency review
When the Volvo Group communicates the currency impact on operating income for Industrial operations, the following factors are included:
I
* The sensitivity analysis on currency rate risks is based on simplifi ed assumptions.
It is not unreasonable for the value in SEK to appreciates by 10% in relation to
other currencies. In reality, currencies usually do not change in the same direc-
tion at any given time, so the actual effect of exchange-rate changes may differ
from the sensitivity analysis. Please refer to table D G H
Changes in currency exchange rates compared to 2012 (Total SEK neg 3.4 bn)
Appreciation of SEK by 10% (Total SEK neg 4.5 bn) in relation to other currencies
0,2
0,3
0
0,1
(1,0)
(0,9)
(0,8)
(0,7)
(0,6)
(0,5)
(0,4)
(0,3)
(0,2)
(0,1)
BRLAUD CAD EUR JPY NOK RUB USD ZAR OtherGBP
H
Sensitivity analysis*
Currency effect on operating income from net fl ows in foreign currency and translation effect when
consolidating operating income in foreign subsidiaries for Industrial operations (H).
125125