Volvo 2013 Annual Report Download - page 113
Download and view the complete annual report
Please find page 113 of the 2013 Volvo annual report below. You can navigate through the pages in the report by either clicking on the pages listed below, or by using the keyword search tool below to find specific information within the annual report.-
 1
1 -
2
-
3
-
4
-
5
-
6
-
7
-
8
-
9
-
10
-
11
-
12
-
13
-
14
-
15
-
16
-
17
-
18
-
19
-
20
-
21
-
22
-
23
-
24
-
25
-
26
-
27
-
28
-
29
-
30
-
31
-
32
-
33
-
34
-
35
-
36
-
37
-
38
-
39
-
40
-
41
-
42
-
43
-
44
-
45
-
46
-
47
-
48
-
49
-
50
-
51
-
52
-
53
-
54
-
55
-
56
-
57
-
58
-
59
-
60
-
61
-
62
-
63
-
64
-
65
-
66
-
67
-
68
-
69
-
70
-
71
-
72
-
73
-
74
-
75
-
76
-
77
-
78
-
79
-
80
-
81
-
82
-
83
-
84
-
85
-
86
-
87
-
88
-
89
-
90
-
91
-
92
-
93
-
94
-
95
-
96
-
97
-
98
-
99
-
100
-
101
-
102
-
 103
103 -
 104
104 -
 105
105 -
 106
106 -
 107
107 -
 108
108 -
 109
109 -
 110
110 -
 111
111 -
 112
112 -
 113
113 -
 114
114 -
 115
115 -
 116
116 -
 117
117 -
 118
118 -
 119
119 -
 120
120 -
 121
121 -
 122
122 -
 123
123 -
124
-
125
-
126
-
127
-
128
-
129
-
130
-
131
-
132
-
133
-
134
-
135
-
136
-
137
-
138
-
139
-
140
-
141
-
142
-
143
-
144
-
145
-
146
-
147
-
148
-
149
-
150
-
151
-
152
-
153
-
154
-
155
-
156
-
157
-
158
-
159
-
160
-
161
-
162
-
163
-
164
-
165
-
166
-
167
-
168
-
169
-
170
-
171
-
172
-
173
-
174
-
175
-
176
-
177
-
178
-
179
-
180
-
181
-
182
-
183
-
184
-
185
-
186
-
187
-
188
-
189
-
190
-
191
-
192
-
193
-
194
-
195
-
196
-
197
-
198
 |
 |

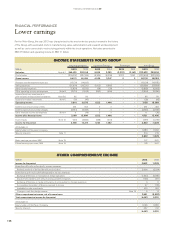
Net sales
Net sales for the Volvo Group decreased by 9%
to SEK 272,622 M in 2013, compared with SEK
299,814 M in the preceding year.
Operating income
Volvo Group’s operating income amounted to
SEK 7,138 M (18,069).
Operating income for the Industrial Operations
decreased to SEK 5,616 M compared with SEK
16,573 M in the preceding year. The Customer
Finance operations’ operating income rose to
SEK 1,522 M (1,496).
Net fi nancial items
Net interest expense amounted to SEK 2,429 M,
compared with SEK 2,496 M in the preceding
year.
Income taxes
The tax expense for the year amounted to
SEK919 M (4,116) corresponding to a tax rate
of 20% (27). The tax expense was positively
impacted by a revaluation of deferred tax and a
tax credit in Brazil.
Income for the period and earnings
per share
The income for the period amounted to SEK
3,802 M (11,378), corresponding to diluted earn-
ings per share of SEK 1.76 (5.61). The return on
shareholders’ equity was 5.0% (14.7).
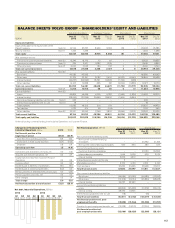
The Volvo Group
Net sales by business area, SEK M 2013 2012 %
Trucks 178,474 189,156 (6)
Construction Equipment 53,437 63,558 (16)
Buses 16,707 19,587 (15)
Volvo Penta 7,550 7,631 (1)
Volvo Aero – 5,219 –
Eliminations and other 9,252 7,048 31
Industrial Operations1265,420 292,198 (9)
Customer Finance 9,539 9,783 (2)
Reclassifi cations and eliminations (2,336) (2,167) (8)
Volvo Group 272,622 299,814 (9)
1 Adjusted for acquired and divested units and changes in currency rates, net sales
decreased by 2%.
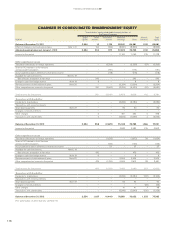
Change in operating income,
SEK bn
Change
(excluding
currency) Currency
impact Total
Operating income 2012 18.1
Change in gross income Industrial operations1(1.6) (5.4) (7.0)
Change in gross income Customer fi nancing 0.3 0 0.3
Higher credit losses2(0.5) 0 (0.5)
Change in group structure (1.4) 0 (1.4)
Lower capitalization of development cost (1.3) 0.1 (1.2)
Lower research and development
expenditures 0.1 0.4 0.5
Higher selling and administrative expenses (2.6) 1.5 (1.1)
Revaluationof assets held for sale
(Volvo Rents) (1.5) 0 (1.5)
Volvo profi t sharing program 0.2 0 0.2
Restructuring and effi ciency program 0.8 0 0.8
Other (0.1) 0 (0.1)
Operating income 2013 7.1
1 During 2013 gross income was affected by lower volumes which was partly
offset by an improvement in price variances and warranty cost.
2 Of the total credit losses SEK 0.3 billion are related to customer fi nancing.
Operating income (loss) by business area, SEK M 2013 2012
Trucks 6,145 10,779
Construction Equipment 2,592 5,667
Buses (190) 37
Volvo Penta 626 549
Volvo Aero – 775
Eliminations and other (3,557) (1,235)
Industrial Operations 5,616 16,573
Customer Finance 1,522 1,496
Volvo Group 7,138 18,069
Operating margin, % 2013 2012
Trucks 3.4 5.7
Construction Equipment 4.9 8.9
Buses (1.1) 0.2
Volvo Penta 8.3 7.2
Volvo Aero – 14.9
Industrial Operations 2.1 5.7
Volvo Group 2.6 6.0
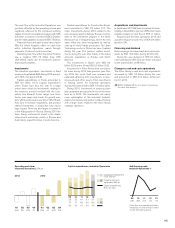
Net sales, SEK bn
12111009
310265218 300
13
273
Operating income, SEK M
2012 2013
Q4
996
Q3
2,398
Q2
3,262
Q1
482
Q4
1,200
Q3
2,920
Q2
7,709
Q1
6,240
109109