Volvo 2013 Annual Report Download - page 77
Download and view the complete annual report
Please find page 77 of the 2013 Volvo annual report below. You can navigate through the pages in the report by either clicking on the pages listed below, or by using the keyword search tool below to find specific information within the annual report.-
 1
1 -
2
-
3
-
4
-
5
-
6
-
7
-
8
-
9
-
10
-
11
-
12
-
13
-
14
-
15
-
16
-
17
-
18
-
19
-
20
-
21
-
22
-
23
-
24
-
25
-
26
-
27
-
28
-
29
-
30
-
31
-
32
-
33
-
34
-
35
-
36
-
37
-
38
-
39
-
40
-
41
-
42
-
43
-
44
-
45
-
46
-
47
-
48
-
49
-
50
-
51
-
52
-
53
-
54
-
55
-
56
-
57
-
58
-
59
-
60
-
61
-
62
-
63
-
64
-
65
-
66
-
 67
67 -
 68
68 -
 69
69 -
 70
70 -
 71
71 -
 72
72 -
 73
73 -
 74
74 -
 75
75 -
 76
76 -
 77
77 -
 78
78 -
 79
79 -
 80
80 -
 81
81 -
 82
82 -
 83
83 -
 84
84 -
 85
85 -
 86
86 -
 87
87 -
88
-
89
-
90
-
91
-
92
-
93
-
94
-
95
-
96
-
97
-
98
-
99
-
100
-
101
-
102
-
103
-
104
-
105
-
106
-
107
-
108
-
109
-
110
-
111
-
112
-
113
-
114
-
115
-
116
-
117
-
118
-
119
-
120
-
121
-
122
-
123
-
124
-
125
-
126
-
127
-
128
-
129
-
130
-
131
-
132
-
133
-
134
-
135
-
136
-
137
-
138
-
139
-
140
-
141
-
142
-
143
-
144
-
145
-
146
-
147
-
148
-
149
-
150
-
151
-
152
-
153
-
154
-
155
-
156
-
157
-
158
-
159
-
160
-
161
-
162
-
163
-
164
-
165
-
166
-
167
-
168
-
169
-
170
-
171
-
172
-
173
-
174
-
175
-
176
-
177
-
178
-
179
-
180
-
181
-
182
-
183
-
184
-
185
-
186
-
187
-
188
-
189
-
190
-
191
-
192
-
193
-
194
-
195
-
196
-
197
-
198
 |
 |

The North American market declined some-
what in the wake of slow economic growth.
Demand in Brazil was strong throughout the year
while the Japanese market was supported by eco-
nomic measures by the government. The truck
market in India was low, refl ecting the slowdown in
the economy while the Chinese market picked up
somewhat compared to 2012.
Varying market conditions
In 2013, the heavy-duty truck market in Europe 30
(EU plus Norway and Switzerland) increased 8%
to 240,200 trucks compared with 221,800 in
2012. For 2014 the total market is expected to be
at a level of about 230,000 heavy-duty trucks.
In2013, the total North American retail market
for heavy-duty trucks decreased by 5% to
236,300 vehicles (249,600). For 2014, the total
market is expected to reach a level of about
250,000 heavy-duty trucks.
In 2013, the Brazilian market increased by 19%
to 103,800 heavy-duty trucks (87,400). For 2014
the total market in Brazil is expected to remain at
the level of about 105,000 heavy-duty trucks.
In Japan the total market for heavy-duty trucks
rose by 6% to 33,800 vehicles (32,000). For 2014
the total market in Japan is expected to remain at
the level of about 35,000 heavy-duty trucks.
In India, the total market for heavy-duty trucks
declined by 33% to 131,700 trucks (195,100). The
total Indian market for medium- duty trucks
declined by 19% to 76,300 trucks (94,200). For
2014 the total market in India is expected to reach
a level of about 145,000 heavy-duty trucks and
about 88,000 medium- duty trucks.
In China, the total market for heavy-duty trucks
reached 774,100 vehicles (636,000). The total
market for medium-duty trucks was 286,800 vehi-
cles (290,300). For 2014 the total market in China
is expected to reach a level of about 700,000
heavy-duty trucks and about 280,000 medium-
duty trucks.
In general the Volvo Group maintained or
in creased its market positions in the main markets.
In Europe the combined market share for heavy-
duty trucks amounted to 24.3% (25.7) and in North
America it was 18.8% (18.3). In Brazil the market
share in heavy-duty trucks increased to 20.0%
(18.2) while it increased to 18.7% (17.5) in Japan.
In India the market share for Eicher amounted to
30.4% (31.4) in the medium-duty segment and to
4.4% (3.9) in the heavy-duty segment.
Orders and deliveries
In 2013, a total of 200,274 trucks where delivered
from the Group’s wholly-owned operations, a
decrease of 2% compared to 2012. Deliveries
decreased in all markets except South America.
Order intake to the Group’s wholly-owned oper-
ations increased by 12% to 214,301 trucks with
increases noted in all markets.
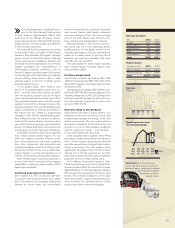
Lower earnings
In 2013, net sales in the truck operations
de creased by 6% to SEK 178,474 M (189,156). Ad -
justed for changes in exchange rates, net sales
increased by 1%.
Operating income excluding restructuring
charges amounted to SEK 6,824 M (12,219), while
the operating margin excluding restructuring
charges was 3.8% (6.5). Restructuring charges
amounted to SEK 679 M (1,440). The lower profi t-
ability compared to 2012 is mainly an effect of a
negative currency impact of SEK 2,698 M, higher
costs for R&D due to reduced capitalization of
R&D investments, higher costs in the manufactur-
ing system and selling expenses associated with
the changeover to new generations of trucks.
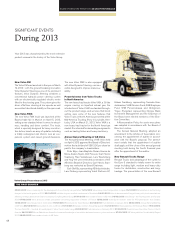
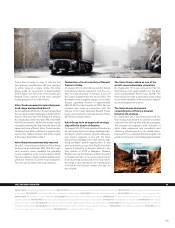
Extensive product renewal
The activity level in the Group’s truck operations
was very high during the year. In Europe, Volvo
Trucks launched the new Volvo FM, Volvo FMX,
Volvo FL and Volvo FE. In June, Renault Trucks pre-
sented a new, comprehensive truck program com-
prising its T, K, C and D series for long- distance
haulage, construction and distribution. In addition,
the new Euro 6 engines were launched.
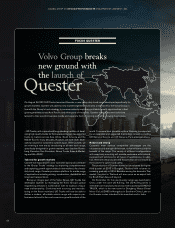
The renewal of the Group’s truck program con-
tinued with the launch of UD Quester, an all-new
series of heavy-duty trucks developed specifi cally
for growth markets in Asia and other areas. In India,
VECV, the Group’s joint venture together with
Eicher Motors, started manufacturing the new 5
liter and 8 liter engines for UD Quester and the
medium-duty truck program in Europe. Towards the
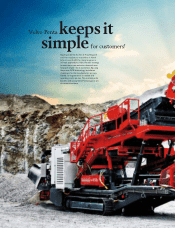
end of the year the Eicher Pro Series, a complete
new range of 11 trucks and buses, was revealed. In
Brazil the new Volvo VM was launched and In
North America, new powertrain packages were
among the product news.
The new trucks, which shall contribute to the
Group’s long-term growth and profi tability, were
very well received by both dealers and customers.
The Group’s new and stronger product programs
have also provided dealers with stronger faith in
the future and motivation for them to continue to
invest and contribute to the development of the
Group’s brands.
Restructuring to strengthen
competitiveness
On January 1, 2013, the Volvo Group introduced a
new organization for its truck dealer networks in
Europe, the Middle East and Africa (EMEA). The
reorganization aims to capitalize more effectively on
opportunities for the Group’s brands and products
in line with the new strategy for the truck operation.
In October, there was a directional decision to
implement changes in the European truck manu-
facturing operations in order to increase effi ciency
and strengthen competitiveness. By optimizing the
industrial structure in Europe, the Group will be
able to build trucks in a much more effi cient way
with lower cost per truck.
At the start of 2013 a program aimed at improv-
ing the overall effi ciency of the Japanese produc-
tion system was announced. The program involves
consolidating manufacturing to the main plant in
Ageo and reducing production capacity in both
engines and truck assembly. Measures are also
ongoing in Japan to lower costs and enhance effi -
ciency in the sales channels within the framework
of the REX program (Retail Excellence).
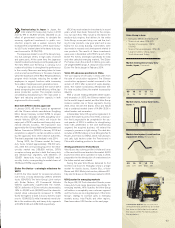
Net sales, SEK bn
1312111009
178.5
189.2 178.5198.9167.3138.9
Net sales by market
Mkr 2013 2012
Europe 73,640 76,365
North America 40,314 42,650
South America 23,318 21,172
Asia 26,740 33,404
Other markets 14,462 15,566
Total 178,474 189,156
Deliveries by market
Number of trucks 2013 2012
Europe 82,088 84,355
North America 44,755 47,806
South America 29,137 23,443
Asia 28,692 31,757
Other markets 15,602 16,899
Total 200,274 204,260
Non- consolidated operations
Eicher (100%) 31,422 39,063
DND (100%) 213 450
Total volumes 231,909 243,773
Market shares, heavy-duty trucks, %
EUROPE
JAPAN
NORTH AMERICA
BRAZIL
10.4 7.9 7.910.9
18.2 20.0
17. 5 18 . 7
15.6 10.1 8.016.3
Operating income (loss)*
and operating margin*
SEK M
%
6,824
12
12,219
6.5
13
6,824
3.8
11
18,227
9.2
10
10,112
6.0
09
(10,805)
(7.8)
*Excl. restructuring changes
73