Volvo 2013 Annual Report Download - page 127
Download and view the complete annual report
Please find page 127 of the 2013 Volvo annual report below. You can navigate through the pages in the report by either clicking on the pages listed below, or by using the keyword search tool below to find specific information within the annual report.-
 1
1 -
2
-
3
-
4
-
5
-
6
-
7
-
8
-
9
-
10
-
11
-
12
-
13
-
14
-
15
-
16
-
17
-
18
-
19
-
20
-
21
-
22
-
23
-
24
-
25
-
26
-
27
-
28
-
29
-
30
-
31
-
32
-
33
-
34
-
35
-
36
-
37
-
38
-
39
-
40
-
41
-
42
-
43
-
44
-
45
-
46
-
47
-
48
-
49
-
50
-
51
-
52
-
53
-
54
-
55
-
56
-
57
-
58
-
59
-
60
-
61
-
62
-
63
-
64
-
65
-
66
-
67
-
68
-
69
-
70
-
71
-
72
-
73
-
74
-
75
-
76
-
77
-
78
-
79
-
80
-
81
-
82
-
83
-
84
-
85
-
86
-
87
-
88
-
89
-
90
-
91
-
92
-
93
-
94
-
95
-
96
-
97
-
98
-
99
-
100
-
101
-
102
-
103
-
104
-
105
-
106
-
107
-
108
-
109
-
110
-
111
-
112
-
113
-
114
-
115
-
116
-
 117
117 -
 118
118 -
 119
119 -
 120
120 -
 121
121 -
 122
122 -
 123
123 -
 124
124 -
 125
125 -
 126
126 -
 127
127 -
 128
128 -
 129
129 -
 130
130 -
 131
131 -
 132
132 -
 133
133 -
 134
134 -
 135
135 -
 136
136 -
 137
137 -
138
-
139
-
140
-
141
-
142
-
143
-
144
-
145
-
146
-
147
-
148
-
149
-
150
-
151
-
152
-
153
-
154
-
155
-
156
-
157
-
158
-
159
-
160
-
161
-
162
-
163
-
164
-
165
-
166
-
167
-
168
-
169
-
170
-
171
-
172
-
173
-
174
-
175
-
176
-
177
-
178
-
179
-
180
-
181
-
182
-
183
-
184
-
185
-
186
-
187
-
188
-
189
-
190
-
191
-
192
-
193
-
194
-
195
-
196
-
197
-
198
 |
 |

SEK
10.1
GBP 1.9
CNY
8.5
INR 0.9
EUR
22.4 JPY 4.4
KRW 3.1
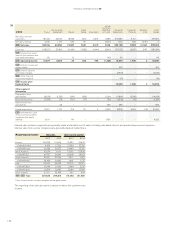
The Volvo Group’s
net assets in different
currencies (SEK bn) =
OTHER
12. 2
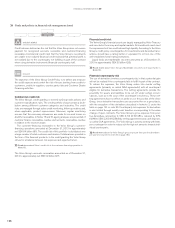
Currencies Market value
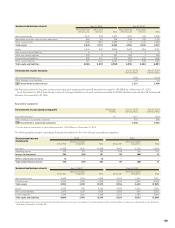
Millions CNY/SEK1USD/SEK USD/KRW USD/CNY SGD/SEK EUR/USD
Due date 2014 4,500 285 276 60 41 5
Due date 2015 – – – 39 13 –
Due date 2016 – – – 9 – –
Total local currency 4,500 285 276 108 54 5
Average contract rate 1.02 6.51 1.09 6.34 5.75 1.28
Market value of outstanding forward contracts, SEK M 212 (2) 50 22 32 3 317
1 The outstanding forward contracts in CNY/SEK is the hedging of future cash fl ow of the acqusition of Dongfeng Commercial Vehicles.
The Volvo Group’s outstanding forward contracts and options contracts for hedging of commercial currency risks
CURRENCY RISKS B
The content in the balance sheet may be affected by changes in different
exchange rates. Currency risks in the Volvo Group’s operations are related
to changes in the value of contracted and expected future payment fl ows
(commercial currency exposure), changes in the value of loans and invest-
ments (fi nancial currency exposure) and changes in the value of assets
and liabilities in foreign subsidiaries (currency exposure of equity).
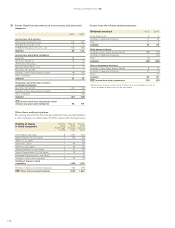
D
Currency Net fi nancial
position incl.
pensions
Impact onearnings before
tax if interest rate rises 1%
A (Interest-rate risks)
Impact on Net fi nancial
position if SEK appreciates
against other currencies 10%
B
(Currency risks)
SEK M
JPY (13,410) (117) 1,341
SEK (9,031) (79) –
USD (7,485) (65) 749
RUB (1,763) (15) 176
CNY 2,077 18 (208)
EUR 1,911 17 (191)
Other (4,365) (38) 436
Total C (32,066) (279) 2,303
Read more about the Industrial Operations net fi nancial position on page 113.
F
POLICY
The aim of the Volvo Group’s currency risk management is to secure cash
fl o w f r o m fi rm fl ows through currency hedges pursuant to the established
currency policy, and to minimize the exposure of fi nancial items in Volvo
Group’s balance sheet. Below is a presentation on how this work is con-
ducted for commercial and fi nancial currency exposure, and for currency
exposure of equity.
INTEREST-RATE RISKS CURRENCY RISKS CREDIT RISKS
FINANCIAL RISKS
OTHER PRICE RISKSLIQUIDITY RISKS
123123