Volvo 2013 Annual Report Download - page 133
Download and view the complete annual report
Please find page 133 of the 2013 Volvo annual report below. You can navigate through the pages in the report by either clicking on the pages listed below, or by using the keyword search tool below to find specific information within the annual report.-
 1
1 -
2
-
3
-
4
-
5
-
6
-
7
-
8
-
9
-
10
-
11
-
12
-
13
-
14
-
15
-
16
-
17
-
18
-
19
-
20
-
21
-
22
-
23
-
24
-
25
-
26
-
27
-
28
-
29
-
30
-
31
-
32
-
33
-
34
-
35
-
36
-
37
-
38
-
39
-
40
-
41
-
42
-
43
-
44
-
45
-
46
-
47
-
48
-
49
-
50
-
51
-
52
-
53
-
54
-
55
-
56
-
57
-
58
-
59
-
60
-
61
-
62
-
63
-
64
-
65
-
66
-
67
-
68
-
69
-
70
-
71
-
72
-
73
-
74
-
75
-
76
-
77
-
78
-
79
-
80
-
81
-
82
-
83
-
84
-
85
-
86
-
87
-
88
-
89
-
90
-
91
-
92
-
93
-
94
-
95
-
96
-
97
-
98
-
99
-
100
-
101
-
102
-
103
-
104
-
105
-
106
-
107
-
108
-
109
-
110
-
111
-
112
-
113
-
114
-
115
-
116
-
117
-
118
-
119
-
120
-
121
-
122
-
 123
123 -
 124
124 -
 125
125 -
 126
126 -
 127
127 -
 128
128 -
 129
129 -
 130
130 -
 131
131 -
 132
132 -
 133
133 -
 134
134 -
 135
135 -
 136
136 -
 137
137 -
 138
138 -
 139
139 -
 140
140 -
 141
141 -
 142
142 -
 143
143 -
144
-
145
-
146
-
147
-
148
-
149
-
150
-
151
-
152
-
153
-
154
-
155
-
156
-
157
-
158
-
159
-
160
-
161
-
162
-
163
-
164
-
165
-
166
-
167
-
168
-
169
-
170
-
171
-
172
-
173
-
174
-
175
-
176
-
177
-
178
-
179
-
180
-
181
-
182
-
183
-
184
-
185
-
186
-
187
-
188
-
189
-
190
-
191
-
192
-
193
-
194
-
195
-
196
-
197
-
198
 |
 |

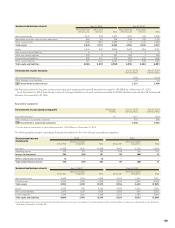
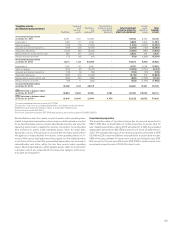
Summarized balance sheets Dec 31, 2013 Dec 31, 2012
VE Commercial
Vehicles, Ltd. Other joint
ventures Total VE Commercial
Vehicles, Ltd. Other joint
ventures Total
Non-current assets 2,179 448 2,627 1,877 512 2,389
Marketable securities, cash and cash equivalents 669 87 756 945 158 1,103
Other current assets 1,698 1,884 3,582 1,713 1,376 3,089
Total assets 4,546 2,419 6,965 4,535 2,046 6,581
Equity 2,405 400 2,805 2,487 484 2,971
Non-current fi nancial liabilities 6 – 6 6 3 9
Other non-currentliabilities 329 8 337 283 7 290
Current fi nancial liabilities 835 901 1,736 822 674 1,496
Other current liabilities 971 1,110 2,081 937 878 1,815
Total equity and liabilities 4,546 2,419 6,965 4,535 2,046 6,581
Investments in joint ventures Dec 31, 2013
Carrying value Dec 31, 2012
Carrying value
VE Commercial Vehicles., Ltd 2,189 2,334
Other holdings in joint ventures 102 144
B/S Investments in joint ventures 2,291 2,478
Net fi nancial position for the joint ventures (excluding post-employment benefi ts) amounted to negative 149 (244) as of December 31, 2013.
As of December 31, 2013, Volvo Group’s share of contingent liabilities in its joint ventures amounted to 62 (61). Dividend received from VE Commercial
Vehicles., Ltd, amounts to 41 (46).
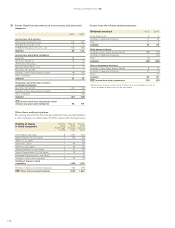
Associated companies
Investments in associated companies Percentage
holding Dec 31, 2013
Carrying value Dec 31, 2012
Carrying value
Deutz AG, Germany125 1,407 1,359
Other holdings in associated companies –679 686
B/S Investments in associated companies 2,086 2,045
1 The fair value of investments in Deutz AG amounted to 1,756 (924) as of December 31, 2013.
The following tables present summarized fi nancial information for the Volvo Group’s associated companies:
Summarized income
statements
2013 2012
Deutz AG1Other associated
companies Total Deutz AG1Other associated
companies Total
Net sales 11,828 3,610 15,438 8,447 3,209 11,656
Operating income 372 80 452 206 65 271
Income for the period 260 (69) 191 98 (88) 10
Other comprehensive income 13–13–––
Total comprehensive income 273 (69) 204 98 (88) 10
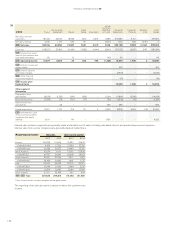
Summarized balance sheets Dec 31, 2013 Dec 31, 2012
Deutz AG1Other associated
companies Total Deutz AG1Other associated
companies Total
Non-current assets 5,669 1,979 7,648 5,612 1,979 7,591
Current assets 4,230 1,498 5,728 3,644 1,654 5,298
Total assets 9,899 3,476 13,375 9,256 3,633 12,889
Equity 4,235 970 5,205 4,090 1,603 5,693
Non-current liabilities 3,516 1,210 4,726 2,835 667 3,502
Current liabilities 2,148 1,296 3,444 2,331 1,363 3,694
Total equity and liabilities 9,899 3,476 13,375 9,256 3,633 12,889
1 Deutz AG equity share is recognized in the Volvo Group with a time lag of one quarter. The Volvo Group’s holding in Deutz AG is of a business-related nature. No dividends
have been received from Deutz AG.
129129129