Volvo 2013 Annual Report Download - page 143
Download and view the complete annual report
Please find page 143 of the 2013 Volvo annual report below. You can navigate through the pages in the report by either clicking on the pages listed below, or by using the keyword search tool below to find specific information within the annual report.-
 1
1 -
2
-
3
-
4
-
5
-
6
-
7
-
8
-
9
-
10
-
11
-
12
-
13
-
14
-
15
-
16
-
17
-
18
-
19
-
20
-
21
-
22
-
23
-
24
-
25
-
26
-
27
-
28
-
29
-
30
-
31
-
32
-
33
-
34
-
35
-
36
-
37
-
38
-
39
-
40
-
41
-
42
-
43
-
44
-
45
-
46
-
47
-
48
-
49
-
50
-
51
-
52
-
53
-
54
-
55
-
56
-
57
-
58
-
59
-
60
-
61
-
62
-
63
-
64
-
65
-
66
-
67
-
68
-
69
-
70
-
71
-
72
-
73
-
74
-
75
-
76
-
77
-
78
-
79
-
80
-
81
-
82
-
83
-
84
-
85
-
86
-
87
-
88
-
89
-
90
-
91
-
92
-
93
-
94
-
95
-
96
-
97
-
98
-
99
-
100
-
101
-
102
-
103
-
104
-
105
-
106
-
107
-
108
-
109
-
110
-
111
-
112
-
113
-
114
-
115
-
116
-
117
-
118
-
119
-
120
-
121
-
122
-
123
-
124
-
125
-
126
-
127
-
128
-
129
-
130
-
131
-
132
-
 133
133 -
 134
134 -
 135
135 -
 136
136 -
 137
137 -
 138
138 -
 139
139 -
 140
140 -
 141
141 -
 142
142 -
 143
143 -
 144
144 -
 145
145 -
 146
146 -
 147
147 -
 148
148 -
 149
149 -
 150
150 -
 151
151 -
 152
152 -
 153
153 -
154
-
155
-
156
-
157
-
158
-
159
-
160
-
161
-
162
-
163
-
164
-
165
-
166
-
167
-
168
-
169
-
170
-
171
-
172
-
173
-
174
-
175
-
176
-
177
-
178
-
179
-
180
-
181
-
182
-
183
-
184
-
185
-
186
-
187
-
188
-
189
-
190
-
191
-
192
-
193
-
194
-
195
-
196
-
197
-
198
 |
 |

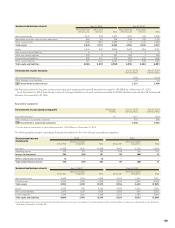
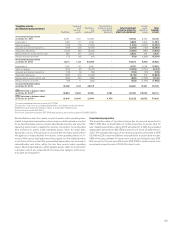
Reclassifi cations and other mainly consist of assets under operating lease
related to legal sales transactions, where revenue is deferred and accounted
for as operating lease revenue. Assets classifi ed as inventory will, when the
operating lease model is applied for revenue recognition, be reclassifi ed
from inventory to assets under operating leases, when the legal sales
transaction occurs. If the product is returned after the lease period, there
will again be a reclassifi cation from assets under operating leases to in -
ventory. When a buy-back agreement has expired, but the related product
is not returned, the cost and the accumulated depreciation are reversed in
reclassifi cation and other, within the line item assets under operating
leases. Most reclassifi cations within tangible assets relate to construction
in progress, which are reclassifi ed to the respective category within prop-
erty, plant and equipment.
Investment properties
The acquisition value of investment properties at year-end amounted to
689 (1,474) after reclassifi cation of certain properties to Assets held för
sale. Capital expenditures during 2013 amounted to 9 (22). Accumulated
depreciation amounted to 362 (720) at year-end, of which 26 (45) refers to
2013. The estimated fair value of investment properties amounted to SEK
0.6 billion (2.3) at year-end. Before reclassifi cation to assets held for sale,
98% of the area available for lease were leased out during the year (95).
Net income for the year was affected by 259 (220) in rental income from
investment properties and of 63 (44) in direct costs.
Tangible assets,
Accumulated depreciation
Buildings
Land and
land
improve-
ments
Machinery
and
equipment3
Construction in
progress, includ-
ing advance
payments
Total investment
property, property,
plant and equipment
Assets
under
operating
leases
Total
tangible
assets
Accumulated depreciation
as of Dec 31, 2011 16,251 1,135 50,286 – 67,672 8,643 76,315
Depreciation41,168 91 4,624 – 5,883 5,616 11, 49 9
Sales/scrapping (102) (13) (1,830) – (1,945) (2,577) (4,522)
Acquired and divested operations (499) (24) (2,873) – (3,396) (162) (3,558)
Translation differences (1,127) (81) (3,052) – (4,260) (385) (4,645)
Reclassifi edfrom assets held for sale 496 23 3,003 – 3,522 109 3,631
Reclassifi cations and other (73) (18) (65) – (156) (1,898) (2,054)
Accumulated depreciation
as of Dec 31, 2012 16,114 1,113 50,093 – 67,320 9,346 76,666
Depreciation41,157 113 4,951 – 6,221 6,146 12,367
Sales/scrapping (252) (8) (3,075) – (3,335) (2,790) (6,125)
Acquired and divested operations (36) (3) (64) – (103) (73) (176)
Translation differences (891) (61) (2,166) – (3,118) 219 (2,899)
Reclassifi edto assets held for sale (595) (35) (268) – (898) (1,238) (2,136)
Reclassifi cations and other (69) 5 (342) – (406) (1,559) (1,965)
Accumulated depreciation
as of Dec 31, 2013 15,428 1,124 49,129 – 65,681 10,051 75,732
B/S Net value in balance sheet
as of Dec 31, 20122, 5 15,881 11,440 19,381 7,487 54,189 29,022 83,211
B/S Net value in balance sheet
as of Dec 31, 20132, 5 15,447 10,040 21,970 4,776 52,233 25,672 77,905
1 Includes capitalized borrowing costs of 73 (134).
2 Acquisition costs less accumulated depreciation, amortization and write-downs.
3 Machinery and equipment pertains mainly to production related assets.
4 Of which write-down 650 (195).
5 Of which, investment property 327 (754) and property, plant and equipment 51,906 (53,435).
139