Volvo 2013 Annual Report Download - page 178
Download and view the complete annual report
Please find page 178 of the 2013 Volvo annual report below. You can navigate through the pages in the report by either clicking on the pages listed below, or by using the keyword search tool below to find specific information within the annual report.-
 1
1 -
2
-
3
-
4
-
5
-
6
-
7
-
8
-
9
-
10
-
11
-
12
-
13
-
14
-
15
-
16
-
17
-
18
-
19
-
20
-
21
-
22
-
23
-
24
-
25
-
26
-
27
-
28
-
29
-
30
-
31
-
32
-
33
-
34
-
35
-
36
-
37
-
38
-
39
-
40
-
41
-
42
-
43
-
44
-
45
-
46
-
47
-
48
-
49
-
50
-
51
-
52
-
53
-
54
-
55
-
56
-
57
-
58
-
59
-
60
-
61
-
62
-
63
-
64
-
65
-
66
-
67
-
68
-
69
-
70
-
71
-
72
-
73
-
74
-
75
-
76
-
77
-
78
-
79
-
80
-
81
-
82
-
83
-
84
-
85
-
86
-
87
-
88
-
89
-
90
-
91
-
92
-
93
-
94
-
95
-
96
-
97
-
98
-
99
-
100
-
101
-
102
-
103
-
104
-
105
-
106
-
107
-
108
-
109
-
110
-
111
-
112
-
113
-
114
-
115
-
116
-
117
-
118
-
119
-
120
-
121
-
122
-
123
-
124
-
125
-
126
-
127
-
128
-
129
-
130
-
131
-
132
-
133
-
134
-
135
-
136
-
137
-
138
-
139
-
140
-
141
-
142
-
143
-
144
-
145
-
146
-
147
-
148
-
149
-
150
-
151
-
152
-
153
-
154
-
155
-
156
-
157
-
158
-
159
-
160
-
161
-
162
-
163
-
164
-
165
-
166
-
167
-
 168
168 -
 169
169 -
 170
170 -
 171
171 -
 172
172 -
 173
173 -
 174
174 -
 175
175 -
 176
176 -
 177
177 -
 178
178 -
 179
179 -
 180
180 -
 181
181 -
 182
182 -
 183
183 -
 184
184 -
 185
185 -
 186
186 -
 187
187 -
 188
188 -
189
-
190
-
191
-
192
-
193
-
194
-
195
-
196
-
197
-
198
 |
 |
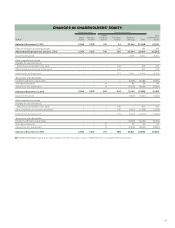
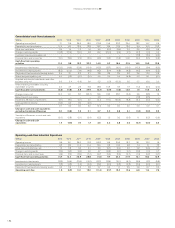
Changes in AB Volvo’s holding of shares and participations are disclosed below:
Group companies Joint ventures
and associated companies Non-Group companies
2013 2012 2013 2012 2013 2012
Adjusted opening balance at January 1 56,832 59,460 3,374 2,401 791 748
Changes in accounting principles – – – – – 347
Acquisitions/New issue of shares 4,203 – – 1,107 – –
Divestments (787) (2,885) – – – (6)
Shareholder’s contribution 1,511– –– 1–
Write-downs/participations in partnerships (996) (110) (31) (31) (4) –
Revaluation of shares in listed companies – – – – 415 (34)
Reclassifi cations – 367 – (103) –(264)
B/S Balance sheet, December 31 60,763 56,832 3,343 3,374 1,203 791
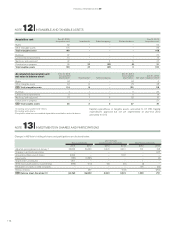
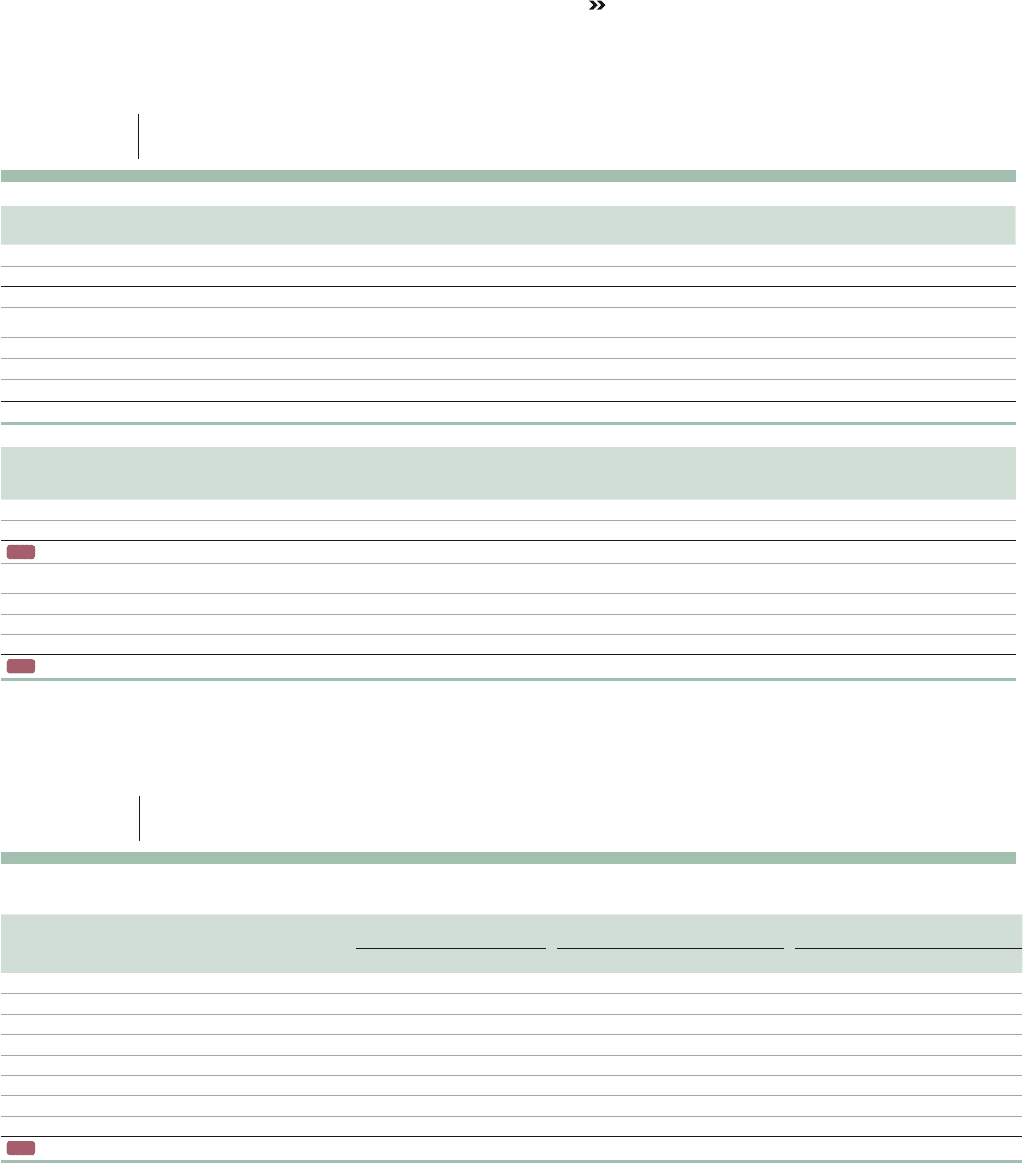
Accumulated depreciation and
net value in balance sheet
Dec 31, 2012
Accumulated
depreciation1Depreciation2Sales/scrapping
Dec 31, 2013
Accumulated
depreciation Dec 31, 2013
Net value in balance sheet3
Rights 52 – – 52 0
Other intangible assets 64 14 – 78 38
B/S Total intangible assets 116 14 – 130 38
Buildings 4 1 – 5 22
Land and land improvements 0 0 – 0 14
Machinery and equipment 31 1 0 32 15
Construction in progress – – – – 21
B/S Total tangible assets 35 2 0 37 72
1 Including accumulated write-downs.
2 Including write-downs.
3 Acquisition value, less accumulated depreciation, amortization and write-downs.
Capital expenditures in tangible assets amounted to 37 (74). Capital
expenditures approved but not yet implemented at year-end 2013
amounted to 0 (1).
Acquisition cost Dec 31, 2012
Acquisition cost Investments Sales/scrapping Reclassifi cations Dec 31, 2013
Acquisition cost
Rights 52 – – – 52
Other intangible assets 116 – – – 116
Total intangible assets 168 – – – 168
Buildings 27 – – – 27
Land and land improvements 14 – – – 14
Machinery and equipment 42 – 0 5 47
Construction in progress 26 37 (37) (5) 21
Total tangible assets 109 37 (37) 0 109
174
FINANCIAL INFORMATION 2013
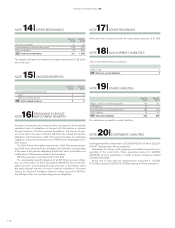
NOTE 13 INVESTMENTS IN SHARES AND PARTICIPATIONS
NOTE 12 INTANGIBLE AND TANGIBLE ASSETS