Volvo 2013 Annual Report Download - page 156
Download and view the complete annual report
Please find page 156 of the 2013 Volvo annual report below. You can navigate through the pages in the report by either clicking on the pages listed below, or by using the keyword search tool below to find specific information within the annual report.-
 1
1 -
2
-
3
-
4
-
5
-
6
-
7
-
8
-
9
-
10
-
11
-
12
-
13
-
14
-
15
-
16
-
17
-
18
-
19
-
20
-
21
-
22
-
23
-
24
-
25
-
26
-
27
-
28
-
29
-
30
-
31
-
32
-
33
-
34
-
35
-
36
-
37
-
38
-
39
-
40
-
41
-
42
-
43
-
44
-
45
-
46
-
47
-
48
-
49
-
50
-
51
-
52
-
53
-
54
-
55
-
56
-
57
-
58
-
59
-
60
-
61
-
62
-
63
-
64
-
65
-
66
-
67
-
68
-
69
-
70
-
71
-
72
-
73
-
74
-
75
-
76
-
77
-
78
-
79
-
80
-
81
-
82
-
83
-
84
-
85
-
86
-
87
-
88
-
89
-
90
-
91
-
92
-
93
-
94
-
95
-
96
-
97
-
98
-
99
-
100
-
101
-
102
-
103
-
104
-
105
-
106
-
107
-
108
-
109
-
110
-
111
-
112
-
113
-
114
-
115
-
116
-
117
-
118
-
119
-
120
-
121
-
122
-
123
-
124
-
125
-
126
-
127
-
128
-
129
-
130
-
131
-
132
-
133
-
134
-
135
-
136
-
137
-
138
-
139
-
140
-
141
-
142
-
143
-
144
-
145
-
 146
146 -
 147
147 -
 148
148 -
 149
149 -
 150
150 -
 151
151 -
 152
152 -
 153
153 -
 154
154 -
 155
155 -
 156
156 -
 157
157 -
 158
158 -
 159
159 -
 160
160 -
 161
161 -
 162
162 -
 163
163 -
 164
164 -
 165
165 -
 166
166 -
167
-
168
-
169
-
170
-
171
-
172
-
173
-
174
-
175
-
176
-
177
-
178
-
179
-
180
-
181
-
182
-
183
-
184
-
185
-
186
-
187
-
188
-
189
-
190
-
191
-
192
-
193
-
194
-
195
-
196
-
197
-
198
 |
 |

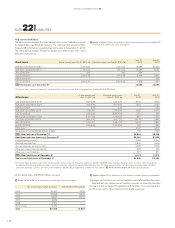
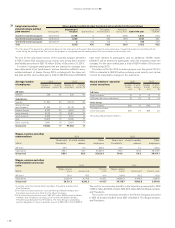
Bond loans Actual interest rate Dec 31, 2013, % Effectiveinterest rate Dec 31, 2013, % Dec 31,
2013 Dec 31,
2012
EUR 2007–2012/2014–2024 0.74–5.04 0.74–5.04 19,883 20,725
SEK 2007–2012/2014–2017 1.76–5.04 1.77–5.04 19,437 15,131
JPY 2013/2016 0.60 0.60 124 –
USD 2009/2015 0.42–5.98 0.42–5.98 5,246 4,861
GBP 2009/2014 – – – 523
CNY2012/2015 3.80–5.90 3.80–6.06 1,895 1,852
B/S Bond loans as of December 311 46,585 43,092
1 Of which loans raised to fi nance the credit portfolio of the customer fi nancing operations totalled25,619 (29,044).
Other loans Actual interest rate
Dec 31, 2013, % Effectiveinterest rate
Dec 31, 2013, % Dec 31,
2013 Dec 31,
2012
USD 2008–2012/2015–2018 0.47–2.46 0.47–2.49 8,105 7,902
EUR 2005–2012/2014–2027 1.59–6.50 1.60–6.50 1,734 2,127
GBP 2011/2014 6.22 6.22 1 902
SEK 2007–2011/2015–2017 1.16–2.91 1.17–2.94 4,180 4,270
CAD 2012/2015 2.74–3.05 2.77–3.08 911 675
MXN 2009–2012/2014–2016 4.30–4.76 4.38–4.87 847 1,673
JPY 2007–2012/2014–2017 0.51–1.31 0.51–1.31 10,772 7,837
BRL 2007/2020 0.33–3.11 0.46–3.16 5,932 5,807
AUD 2012/2015 3.74–6.05 3.79–6.05 516 690
Other loans 3,7264,612
Revaluation of outstanding derivatives to SEK 140 1,933
B/S Other loans as of December 311 36,864 38,428
Bond loans and other loans as of December 31 83,449 81,520
Deferred leasing income 2,462 2,247
Residual value liabilities 4,840 4,439
Accrued expenses service contracts 2,928 2,548
Other non–current fi nancial liabilities 280 609
Other non–current liabilities 967 871
B/S Other liabilities as of December 31 11, 477 10 ,714
Non-current liabilities as of December 31 94,926 92,234
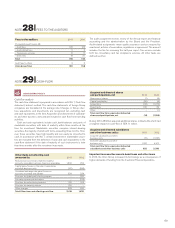
1 Of which loans raised to fi nance the credit portfolio of the customer fi nancing operations 20,590 (16,874). Volvo Treasury employs cross-currency interest swaps to
be able to offer lending and borrowing in various currencies without increasing Volvo Group’s risk. The table presents Volvo Group’s fi nancial net position, including
pensions, listed by currency. Of non-current liabilities, 83,715 (82,153) pertains to fi nancial instruments. Refer also to Note 30 Financial instruments.
Of the above loans, 4,928 (3,723) are secured.
Refer to Note 23 for an explanation of changes to assets pledged.
Non-currentloans mature as follows Not utilized credit facilities
2014 25,520 3,220
2015 30,928 17,904
2016 16,845 10,743
2017 4,629 –
2018 3,204 –
2019 or later 2,323 –
Total 83 ,449 31,8 67
Refer to Note 15 for maturities of non-current customer fi nancing receivables.
The major part of other non-current liabilities will mature within fi ve years.
Granted but not utilized credit facilities consists of stand-by facilities
for loans. A fee is charged for granted credit facilities, this is recognized in
profi t or loss within other fi nancial income and expenses.
Non-current liabilities
The tables below disclose the Volvo Group’s non-current liabilities in which
the largest loans are listed by currency. The main part are issued by Volvo
Treasury AB. Information regarding loan terms refer to December 31, 2013.
The Volvo Group hedges foreign-exchange and interest-rate risks using
derivative instruments.
Refer to Note 4 Goals and policies in fi nancial risk management and Note 30
Financial Instruments for more information.
NOTE 22 LIABILITIES
152
FINANCIAL INFORMATION 2013