Volvo 2013 Annual Report Download - page 115
Download and view the complete annual report
Please find page 115 of the 2013 Volvo annual report below. You can navigate through the pages in the report by either clicking on the pages listed below, or by using the keyword search tool below to find specific information within the annual report.-
 1
1 -
2
-
3
-
4
-
5
-
6
-
7
-
8
-
9
-
10
-
11
-
12
-
13
-
14
-
15
-
16
-
17
-
18
-
19
-
20
-
21
-
22
-
23
-
24
-
25
-
26
-
27
-
28
-
29
-
30
-
31
-
32
-
33
-
34
-
35
-
36
-
37
-
38
-
39
-
40
-
41
-
42
-
43
-
44
-
45
-
46
-
47
-
48
-
49
-
50
-
51
-
52
-
53
-
54
-
55
-
56
-
57
-
58
-
59
-
60
-
61
-
62
-
63
-
64
-
65
-
66
-
67
-
68
-
69
-
70
-
71
-
72
-
73
-
74
-
75
-
76
-
77
-
78
-
79
-
80
-
81
-
82
-
83
-
84
-
85
-
86
-
87
-
88
-
89
-
90
-
91
-
92
-
93
-
94
-
95
-
96
-
97
-
98
-
99
-
100
-
101
-
102
-
103
-
104
-
 105
105 -
 106
106 -
 107
107 -
 108
108 -
 109
109 -
 110
110 -
 111
111 -
 112
112 -
 113
113 -
 114
114 -
 115
115 -
 116
116 -
 117
117 -
 118
118 -
 119
119 -
 120
120 -
 121
121 -
 122
122 -
 123
123 -
 124
124 -
 125
125 -
126
-
127
-
128
-
129
-
130
-
131
-
132
-
133
-
134
-
135
-
136
-
137
-
138
-
139
-
140
-
141
-
142
-
143
-
144
-
145
-
146
-
147
-
148
-
149
-
150
-
151
-
152
-
153
-
154
-
155
-
156
-
157
-
158
-
159
-
160
-
161
-
162
-
163
-
164
-
165
-
166
-
167
-
168
-
169
-
170
-
171
-
172
-
173
-
174
-
175
-
176
-
177
-
178
-
179
-
180
-
181
-
182
-
183
-
184
-
185
-
186
-
187
-
188
-
189
-
190
-
191
-
192
-
193
-
194
-
195
-
196
-
197
-
198
 |
 |

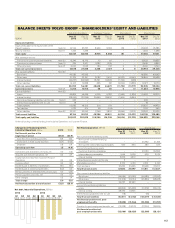
Total new fi nancing volume in 2013 amounted
to SEK 47.0 billion (46.6). Adjusted for changes in
exchange rates, new business volume in creased
by 5.9% compared to 2012. In total, 51,466 new
Volvo Group vehicles and machines (50,994)
were fi nanced during the year. In the markets
where fi nancing is offered, the average pene-
tration rate was 27% (27).
As of December 31, 2013, the net credit port-
folio amounted to SEK 103,873 M (99,690). The
funding of the credit portfolio is matched in terms
of maturity, interest rates and currencies in
accordance with Volvo Group policy. For further
information see note 4 to the Consolidated fi nan-
cial statements.
The operating income for the year amounted
to SEK 1,522 M compared to SEK 1,496 M in
the previous year. Return on shareholders’ equity
was 12.1% (12.5). The equity ratio at the end of
the year was 8.1% (8.1). Improvements in gross
income and operating expenses were partially
offset by higher provisions.
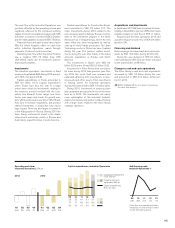
During the year, credit provision expenses
amounted to SEK 923 M (639) while write-offs
of SEK 719 M (577) were recorded. Third quar-
ter provisions and write-offs were higher than
normal due to deterioration of collateral posi-
tions and values related to non-performing loans
and leases in Spain stemming from the global
fi nancial crisis in 2009 and 2010 caused by the
continuing recession and protracted legal pro-
cesses in that country. The write-off ratio for 2013
was 0.71% (0.58). At the end of December 31,
2013, credit reserves were 1.31% (1.23) of the
credit portfolio.
Income Statement Customer Finance, SEK M 2013 2012
Finance and lease income 9,539 9,783
Finance and lease expenses (5,534) (6,036)
Gross income 4,005 3,747
Selling and administrative expenses (1,640) (1,694)
Credit provision expenses (923) (639)
Other operating income and expenses 79 83
Operating income (loss) 1,522 1,496
Income taxes (468) (434)
Income (loss) for the period 1,054 1,062
Return on Equity, % 12.1 12.5
Key ratios, Customer Finance1 2013 2012
Credit portfolio net, SEK M 103,873 99,690
Operating income, SEK M 1,522 1,496
Return on shareholders’ equity, % 12.1 12.5
Total penetration rate, % 27 27
Penetration by business area1, %
Volvo CE 36 37
Volvo Trucks 30 30
Renault Trucks 21 23
MackTrucks 21 19
Buses 16 21
UD Trucks 12 13
1 Share of unit sales fi nanced by Volvo Financial Services in relation to the total num-
ber units sold by the Volvo Group in markets where fi nancial services are offered.
Customer Finance Operations
111111