Volvo 2013 Annual Report Download - page 147
Download and view the complete annual report
Please find page 147 of the 2013 Volvo annual report below. You can navigate through the pages in the report by either clicking on the pages listed below, or by using the keyword search tool below to find specific information within the annual report.-
 1
1 -
2
-
3
-
4
-
5
-
6
-
7
-
8
-
9
-
10
-
11
-
12
-
13
-
14
-
15
-
16
-
17
-
18
-
19
-
20
-
21
-
22
-
23
-
24
-
25
-
26
-
27
-
28
-
29
-
30
-
31
-
32
-
33
-
34
-
35
-
36
-
37
-
38
-
39
-
40
-
41
-
42
-
43
-
44
-
45
-
46
-
47
-
48
-
49
-
50
-
51
-
52
-
53
-
54
-
55
-
56
-
57
-
58
-
59
-
60
-
61
-
62
-
63
-
64
-
65
-
66
-
67
-
68
-
69
-
70
-
71
-
72
-
73
-
74
-
75
-
76
-
77
-
78
-
79
-
80
-
81
-
82
-
83
-
84
-
85
-
86
-
87
-
88
-
89
-
90
-
91
-
92
-
93
-
94
-
95
-
96
-
97
-
98
-
99
-
100
-
101
-
102
-
103
-
104
-
105
-
106
-
107
-
108
-
109
-
110
-
111
-
112
-
113
-
114
-
115
-
116
-
117
-
118
-
119
-
120
-
121
-
122
-
123
-
124
-
125
-
126
-
127
-
128
-
129
-
130
-
131
-
132
-
133
-
134
-
135
-
136
-
 137
137 -
 138
138 -
 139
139 -
 140
140 -
 141
141 -
 142
142 -
 143
143 -
 144
144 -
 145
145 -
 146
146 -
 147
147 -
 148
148 -
 149
149 -
 150
150 -
 151
151 -
 152
152 -
 153
153 -
 154
154 -
 155
155 -
 156
156 -
 157
157 -
158
-
159
-
160
-
161
-
162
-
163
-
164
-
165
-
166
-
167
-
168
-
169
-
170
-
171
-
172
-
173
-
174
-
175
-
176
-
177
-
178
-
179
-
180
-
181
-
182
-
183
-
184
-
185
-
186
-
187
-
188
-
189
-
190
-
191
-
192
-
193
-
194
-
195
-
196
-
197
-
198
 |
 |

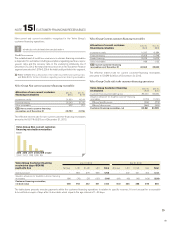
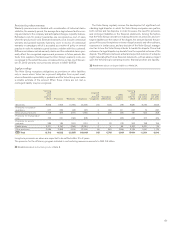
Current receivables Dec 31,
2013 Dec 31,
2012
Other interest-bearing fi nancial receivables 909 2,574
Accounts receivable 29,415 26,516
Prepaid expenses and accrued income 2,356 2,362
VAT receivables 3,033 3,506
Other fi nancial receivables 1,411 1,220
Other receivables 5,854 5,202
Current receivables, after deduction of
valuation allowances for doubtful accounts
receivable142,978 41,380
1 Of current receivables, 31,497 (31,143) pertains to fi nancial instruments.
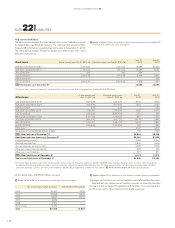
Credit risks in accounts receivable
Change of valuation allowance
for doubtful accounts receivable Dec 31,
2013 Dec 31,
2012
Valuation allowance for doubtful accounts
receivables as of December 31, preceding year 665 720
New valuation allowance charged to income 291 220
Reversal of valuation allowance charged
to income (159) (147)
Utilization of valuation allowance related
to actual losses (114) (89)
Acquired and divested operations (16) 8
Translation differences (19) (39)
Reclassifi cations, etc. (42) (8)
Valuation allowance for doubtful accounts
receivables as of December 31 606 665
Refer to Note 4 for more information regarding the Volvo Group’s fi nancial
risks.
Refer to Note 15 for more information regarding credit risk in customer
fi n a n c i n g r e c e i v a b l e s .
Refer to Note 30 for information regarding goals and policies for fi nancial
instruments.
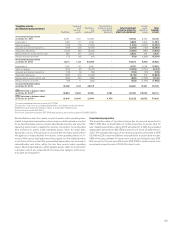
Age analysis of portfolio value
– Accounts receivable
Dec 31, 2013 Dec 31, 2012
Not Due 1–30 31–90 >90 Total Not Due 1–30 31–90 >90 Total
Accounts receivable gross 27,056 1,293 593 1,079 30,020 24,579 1,208 510 884 27,181
Provision for doubtful accounts receivable (90) (18) (25) (473) (606) (156) (3) (25) (481) (665)
Accounts receivable net 26,966 1,275 568 606 29,415 24,423 1,205 485 403 26,516
Inventories
Inventories are recognized at the lower of cost and net realizable value.
The cost is established using the fi rst-in, fi rst-out method (FIFO) and is
based on the standard cost method, including costs for all direct manu-
facturing expenses and the attributable share of capacity and other
manu facturing-related costs. The standard costs are tested regularly and
adjustments are made based on current conditions. Costs for research
and development, selling, administration and fi nancial expenses are not
in cluded. Net realizable value is calculated as the selling price less costs
attributable to the sale.
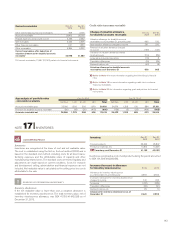
Inventory Dec 31,
2013 Dec 31,
2012
Finished products 26,339 25,847
Production materials, etc . 14, 814 14,246
B/S Inventory as of December 31 41,153 40,093
Inventories recognized as cost of sold products during the period amounted
to SEK 191,509 M (208,958).
Increase (decrease) in allowance
for inventory obsolescence 2013 2012
Allowance for inventory obsolescence
as of December 31, preceding year 2,593 2,604
Increase in allowance for inventory obsolescence
charged to income 510 456
Scrapping (452) (389)
Translation differences (39) (91)
Reclassifi cations, etc. 29 13
Allowance for inventory obsolescence as of
December 31 2,641 2,593
ACCOUNTING POLICY
Inventory obsolescence
If the net realizable value is lower than cost, a valuation allowance is
established for inventory obsolescence. The total inventory value, net of
inventory obsolescence allowance, was SEK 41,153 M (40,093) as of
December 31, 2013.
SOURCES OF ESTIMATION UNCERTAINTY
!
NOTE 17 INVENTORIES
143