Volvo 2013 Annual Report Download - page 114
Download and view the complete annual report
Please find page 114 of the 2013 Volvo annual report below. You can navigate through the pages in the report by either clicking on the pages listed below, or by using the keyword search tool below to find specific information within the annual report.-
 1
1 -
2
-
3
-
4
-
5
-
6
-
7
-
8
-
9
-
10
-
11
-
12
-
13
-
14
-
15
-
16
-
17
-
18
-
19
-
20
-
21
-
22
-
23
-
24
-
25
-
26
-
27
-
28
-
29
-
30
-
31
-
32
-
33
-
34
-
35
-
36
-
37
-
38
-
39
-
40
-
41
-
42
-
43
-
44
-
45
-
46
-
47
-
48
-
49
-
50
-
51
-
52
-
53
-
54
-
55
-
56
-
57
-
58
-
59
-
60
-
61
-
62
-
63
-
64
-
65
-
66
-
67
-
68
-
69
-
70
-
71
-
72
-
73
-
74
-
75
-
76
-
77
-
78
-
79
-
80
-
81
-
82
-
83
-
84
-
85
-
86
-
87
-
88
-
89
-
90
-
91
-
92
-
93
-
94
-
95
-
96
-
97
-
98
-
99
-
100
-
101
-
102
-
103
-
 104
104 -
 105
105 -
 106
106 -
 107
107 -
 108
108 -
 109
109 -
 110
110 -
 111
111 -
 112
112 -
 113
113 -
 114
114 -
 115
115 -
 116
116 -
 117
117 -
 118
118 -
 119
119 -
 120
120 -
 121
121 -
 122
122 -
 123
123 -
 124
124 -
125
-
126
-
127
-
128
-
129
-
130
-
131
-
132
-
133
-
134
-
135
-
136
-
137
-
138
-
139
-
140
-
141
-
142
-
143
-
144
-
145
-
146
-
147
-
148
-
149
-
150
-
151
-
152
-
153
-
154
-
155
-
156
-
157
-
158
-
159
-
160
-
161
-
162
-
163
-
164
-
165
-
166
-
167
-
168
-
169
-
170
-
171
-
172
-
173
-
174
-
175
-
176
-
177
-
178
-
179
-
180
-
181
-
182
-
183
-
184
-
185
-
186
-
187
-
188
-
189
-
190
-
191
-
192
-
193
-
194
-
195
-
196
-
197
-
198
 |
 |

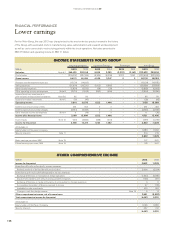
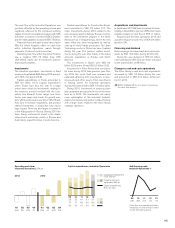
In 2013, net sales for the Volvo Group’s Indus-
trial Operations decreased by 9% to SEK
265,420 M (292,198). Compared with 2012,
sales decreased in all of the Group’s markets
except South America. Adjusted for changes in
exchange rates net sales declined by 2%.
Lower earnings
In 2013, operating income for the Volvo Group’s
Industrial Operations amounted to SEK 5,616
M compared to SEK 16,573 M in the preceding
year. The operating margin for the Industrial
Operations amounted to 2.1% (5.7). Excluding
restructuring charges of SEK 715 M (1,550)
operating income amounted to SEK 6,332 M
(18,123) and the operating margin to 2.4%
(6.2).
The lower profi tability is primarily an effect of
lower volumes, negative currency impact, reval-
uation of assets held for sale (Volvo Rents),
lower capitalization of research and development
expenses, higher selling and administration ex -
penses, that Volvo Aero contributed to the in -
come for the fi rst three quarters of 2012 and
that the divestment of Volvo Aero had a positive
impact during 2012. Lower restructuring charges,
improved price variances and lower warranty
costs had a positive impact on profi tability.
Impact of exchange rates on operating
income
Operating income for 2013 was negatively
impacted by approximately SEK 3.4 billion as a
consequence of changes in currency exchange
rates when compared with 2012.
Income Statement Industrial Operations, SEK M 2013 2012
Net sales 265,420 292,198
Cost of sales (209,307) (227,745)
Gross income 56,113 64,454
Gross margin, % 21.1 22.1
Research and development expenses (15,124) (14,635)
Selling expenses (26,904) (26,230)
Administrative expenses (5,824) (5,535)
Other operating income and expenses (2,710) (1,538)
Income (loss) from investments in joint ventures
andassociated companies 96 99
Income from other investments (31) (42)
Operating income (loss) Industrial Operations 5,616 16,573
Operating margin, % 2.1 5.7
Impact of exchange rates on operating income
Compared with preceding year, SEK M
Net sales1(15,819)
Cost of sales 10,356
Research and development expenses 455
Selling and administrative expenses 1,606
Total effect of changes in exchange rates
on operating income (3,402)
1 The Volvo Group sales are reported at monthly average rates.
Operating net fl ow per currency
Local currency1, million 2013 2012
USD 2,112 4,421
EUR 501 (158)
GBP 631 472
CAD 534 600
JPY(X100) (128) (181)
1 The predominant part of the operations in the Volvo Group are situated outside
Sweden. Therefore the fl uctuations in currency rates affecting the net fl ow in
foreign currency are in many cases not against SEK.
Net sales by market area, SEK M 2013 2012 %
Western Europe 84,293 88,325 (5)
Eastern Europe 18,626 20,751 (10)
North America 60,237 68,297 (12)
South America 28,751 27,970 3
Asia 52,805 64,667 (18)
Other markets 20,708 22,188 (7)
Total Industrial Operations 265,420 292,198 (9)
Research and development expenses
12111009
13.313.013.2
4.4
14.6
5.05.06.3
Research and development
expenses, SEK bn
Research and development
expenses, % of Industrial
Operations’ net sales
13
15.1
5.7
Industrial Operations
110
FINANCIAL INFORMATION 2013
110