Volvo 2013 Annual Report Download - page 169
Download and view the complete annual report
Please find page 169 of the 2013 Volvo annual report below. You can navigate through the pages in the report by either clicking on the pages listed below, or by using the keyword search tool below to find specific information within the annual report.-
 1
1 -
2
-
3
-
4
-
5
-
6
-
7
-
8
-
9
-
10
-
11
-
12
-
13
-
14
-
15
-
16
-
17
-
18
-
19
-
20
-
21
-
22
-
23
-
24
-
25
-
26
-
27
-
28
-
29
-
30
-
31
-
32
-
33
-
34
-
35
-
36
-
37
-
38
-
39
-
40
-
41
-
42
-
43
-
44
-
45
-
46
-
47
-
48
-
49
-
50
-
51
-
52
-
53
-
54
-
55
-
56
-
57
-
58
-
59
-
60
-
61
-
62
-
63
-
64
-
65
-
66
-
67
-
68
-
69
-
70
-
71
-
72
-
73
-
74
-
75
-
76
-
77
-
78
-
79
-
80
-
81
-
82
-
83
-
84
-
85
-
86
-
87
-
88
-
89
-
90
-
91
-
92
-
93
-
94
-
95
-
96
-
97
-
98
-
99
-
100
-
101
-
102
-
103
-
104
-
105
-
106
-
107
-
108
-
109
-
110
-
111
-
112
-
113
-
114
-
115
-
116
-
117
-
118
-
119
-
120
-
121
-
122
-
123
-
124
-
125
-
126
-
127
-
128
-
129
-
130
-
131
-
132
-
133
-
134
-
135
-
136
-
137
-
138
-
139
-
140
-
141
-
142
-
143
-
144
-
145
-
146
-
147
-
148
-
149
-
150
-
151
-
152
-
153
-
154
-
155
-
156
-
157
-
158
-
 159
159 -
 160
160 -
 161
161 -
 162
162 -
 163
163 -
 164
164 -
 165
165 -
 166
166 -
 167
167 -
 168
168 -
 169
169 -
 170
170 -
 171
171 -
 172
172 -
 173
173 -
 174
174 -
 175
175 -
 176
176 -
 177
177 -
 178
178 -
 179
179 -
180
-
181
-
182
-
183
-
184
-
185
-
186
-
187
-
188
-
189
-
190
-
191
-
192
-
193
-
194
-
195
-
196
-
197
-
198
 |
 |

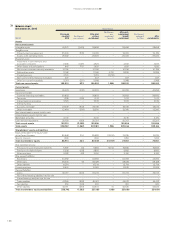
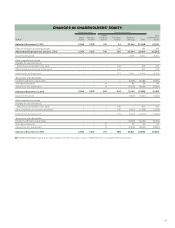
Balance sheet
January 1, 2012 Volvo Group
SEK M
Previously
reported as of
Jan 1, 2012
Restatement
Joint Ventures
After
restatement Joint
Ventures
Restatement
post-employment
benefi ts
After post-
employment
benefi t
restatement
Assets
Non-current assets
Intangible assets 39,507 (1,729) 37,778 – 37,778
Tangible assets
Property, plant and equipment 54,540 (636) 53,904 – 53,904
Assets under operating leases 23,922 – 23,922 – 23,922
Financial assets
Investments in Joint Venturs and associated companies 684 2,612 3,296 – 3,296
Other shares and participations 1,190 419 1,609 – 1,609
Non-current customer-fi nancing receivables 40,618 – 40,618 – 40,618
Deferred ta x assets 12,838 (19) 12,819 3,980 16,799
Prepaid pensions 2,277 – 2,277 (2,277) 0
Non-current interest-bearing receivables 694 (51) 643 – 643
Other non-current receivables 4,315 (11) 4,304 – 4,304
Total non-current assets 180,585 585 181,170 1,703 182,873
Current assets
Inventories 44,599 (363) 44,236 – 44,236
Current receivables
Customer-fi nancing receivables 38,081 – 38,081 – 38,081
Tax assets 1,200 (180) 1,020 – 1,020
Interest-bearing receivables 667 – 667 – 667
Internal funding –––––
Accounts receivable 27,699 (768) 26,931 – 26,931
O ther re c e i vabl e s 13 , 8 25 (114) 13 ,711 – 13 ,711
Non interest-bearing assets held for sale 9,344 – 9,344 117 9,461
Interest-bearing assets held for sale 4 – 4 – 4
Marketable securities 6,862 – 6,862 – 6,862
Cash and cash equivalents 30,379 (822) 29,557 – 29,557
Total current assets 172,6 59 (2, 248) 170,411 117 170,528
Total assets 353,244 (1,663) 351,581 1,820 353,401
Shareholders’ equity and liabilities
Equity attributable to the equity holders of the parent company 84,581 (5) 84,576 (8,821) 75,755
Minority interests 1,100 – 1,100 – 1,100
Total shareholders’ equity 85,681 (5) 85,676 (8,821) 76,855
Non-current provisions
Provisions for post-employment benefi ts 6,665 (10) 6,655 10,078 16,733
Provisions for deferred taxes 5,636 (175) 5,461 – 5,461
Other provisions 5,648 (89) 5,559 – 5,559
Non-current liabilities
Bond loans 38,192 – 38,192 – 38,192
Other loans 47,765 (5) 47,760 – 47,760
Other liabilities 10,447 (1) 10,446 – 10,446
Current provisions 9,531 – 9,531 – 9,531
Current liabilities
Loans 44,522 (236) 44,286 – 44,286
Non interest-bearing liabilities held for sale 4,710 – 4,710 – 4,710
Interest-bearing liabilities held for sale 6 – 6 532 538
Trade payables 56,788 (688) 56,100 – 56,100
Tax liabilities 2,391 – 2,391 – 2,391
Other liabilities 35,262 (453) 34,809 31 34,840
Total shareholders’ equity and liabilities 353,244 (1,663) 351,581 1,820 353,401
165