Volvo 2013 Annual Report Download - page 173
Download and view the complete annual report
Please find page 173 of the 2013 Volvo annual report below. You can navigate through the pages in the report by either clicking on the pages listed below, or by using the keyword search tool below to find specific information within the annual report.-
 1
1 -
2
-
3
-
4
-
5
-
6
-
7
-
8
-
9
-
10
-
11
-
12
-
13
-
14
-
15
-
16
-
17
-
18
-
19
-
20
-
21
-
22
-
23
-
24
-
25
-
26
-
27
-
28
-
29
-
30
-
31
-
32
-
33
-
34
-
35
-
36
-
37
-
38
-
39
-
40
-
41
-
42
-
43
-
44
-
45
-
46
-
47
-
48
-
49
-
50
-
51
-
52
-
53
-
54
-
55
-
56
-
57
-
58
-
59
-
60
-
61
-
62
-
63
-
64
-
65
-
66
-
67
-
68
-
69
-
70
-
71
-
72
-
73
-
74
-
75
-
76
-
77
-
78
-
79
-
80
-
81
-
82
-
83
-
84
-
85
-
86
-
87
-
88
-
89
-
90
-
91
-
92
-
93
-
94
-
95
-
96
-
97
-
98
-
99
-
100
-
101
-
102
-
103
-
104
-
105
-
106
-
107
-
108
-
109
-
110
-
111
-
112
-
113
-
114
-
115
-
116
-
117
-
118
-
119
-
120
-
121
-
122
-
123
-
124
-
125
-
126
-
127
-
128
-
129
-
130
-
131
-
132
-
133
-
134
-
135
-
136
-
137
-
138
-
139
-
140
-
141
-
142
-
143
-
144
-
145
-
146
-
147
-
148
-
149
-
150
-
151
-
152
-
153
-
154
-
155
-
156
-
157
-
158
-
159
-
160
-
161
-
162
-
 163
163 -
 164
164 -
 165
165 -
 166
166 -
 167
167 -
 168
168 -
 169
169 -
 170
170 -
 171
171 -
 172
172 -
 173
173 -
 174
174 -
 175
175 -
 176
176 -
 177
177 -
 178
178 -
 179
179 -
 180
180 -
 181
181 -
 182
182 -
 183
183 -
184
-
185
-
186
-
187
-
188
-
189
-
190
-
191
-
192
-
193
-
194
-
195
-
196
-
197
-
198
 |
 |

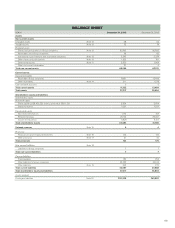
BALANCE SHEET
SEK M December 31, 2013 December 31, 2012
Assets
Non-current assets
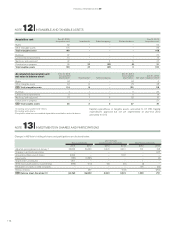
Intangible assets Note 12 38 52
Tangible assets Note 12 72 74
Financial assets
Shares and participations in Group companies Note 13 60,763 56,832
Receivables from Group companies 59 83
Investments in joint ventures and associated companies Note 13 3,343 3,374
Other shares and participations Note 13 1,203 791
Deferred tax assets Note 11 2,550 1,964
Other non-current receivables 27 0
Total non-current assets 68,055 63,170
Current assets
Current receivables
Receivables Group companies 8,951 12,406
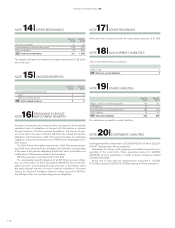
Otherreceivables Note 14 311 1,078
Cash and bank accounts 00
Total current assets 9,262 13,484
Total assets 77,317 76,654
Shareholders’ equity and liabilities
Shareholders’ equity
Restricted equity
Share capital (2,128,420,220 shares, quota value SEK 1.20) 2,554 2,554
Statutory reserve 7,337 7,337
Unrestricted equity
Non-restricted reserves 1,172 747
Retained earnings 25,142 26,041
Income for the period (1,621) 5,101
Total shareholders’ equity 34,584 41,780
Untaxed reserves Note 15 54
Provisions
Provisions for post-employment benefi ts Note 16 133 135
Other provisions Note 17 31 40
Total provisions 164 175
Non-current liabilities Note 18
Liabilities to Group companies 7 7
Total non-current liabilities 77
Current liabilities
Trade payables 183 254
Other liabilities to Group companies 42,032 34,164
Other liabilities Note 19 342 270
Total current liabilities 42,557 34,688
Total shareholders’ equity and liabilities 77,317 76,654
Assets pledged ––
Contingent liabilities Note 20 232,308 243,887
169