Volvo 2013 Annual Report Download - page 162
Download and view the complete annual report
Please find page 162 of the 2013 Volvo annual report below. You can navigate through the pages in the report by either clicking on the pages listed below, or by using the keyword search tool below to find specific information within the annual report.-
 1
1 -
2
-
3
-
4
-
5
-
6
-
7
-
8
-
9
-
10
-
11
-
12
-
13
-
14
-
15
-
16
-
17
-
18
-
19
-
20
-
21
-
22
-
23
-
24
-
25
-
26
-
27
-
28
-
29
-
30
-
31
-
32
-
33
-
34
-
35
-
36
-
37
-
38
-
39
-
40
-
41
-
42
-
43
-
44
-
45
-
46
-
47
-
48
-
49
-
50
-
51
-
52
-
53
-
54
-
55
-
56
-
57
-
58
-
59
-
60
-
61
-
62
-
63
-
64
-
65
-
66
-
67
-
68
-
69
-
70
-
71
-
72
-
73
-
74
-
75
-
76
-
77
-
78
-
79
-
80
-
81
-
82
-
83
-
84
-
85
-
86
-
87
-
88
-
89
-
90
-
91
-
92
-
93
-
94
-
95
-
96
-
97
-
98
-
99
-
100
-
101
-
102
-
103
-
104
-
105
-
106
-
107
-
108
-
109
-
110
-
111
-
112
-
113
-
114
-
115
-
116
-
117
-
118
-
119
-
120
-
121
-
122
-
123
-
124
-
125
-
126
-
127
-
128
-
129
-
130
-
131
-
132
-
133
-
134
-
135
-
136
-
137
-
138
-
139
-
140
-
141
-
142
-
143
-
144
-
145
-
146
-
147
-
148
-
149
-
150
-
151
-
 152
152 -
 153
153 -
 154
154 -
 155
155 -
 156
156 -
 157
157 -
 158
158 -
 159
159 -
 160
160 -
 161
161 -
 162
162 -
 163
163 -
 164
164 -
 165
165 -
 166
166 -
 167
167 -
 168
168 -
 169
169 -
 170
170 -
 171
171 -
 172
172 -
173
-
174
-
175
-
176
-
177
-
178
-
179
-
180
-
181
-
182
-
183
-
184
-
185
-
186
-
187
-
188
-
189
-
190
-
191
-
192
-
193
-
194
-
195
-
196
-
197
-
198
 |
 |
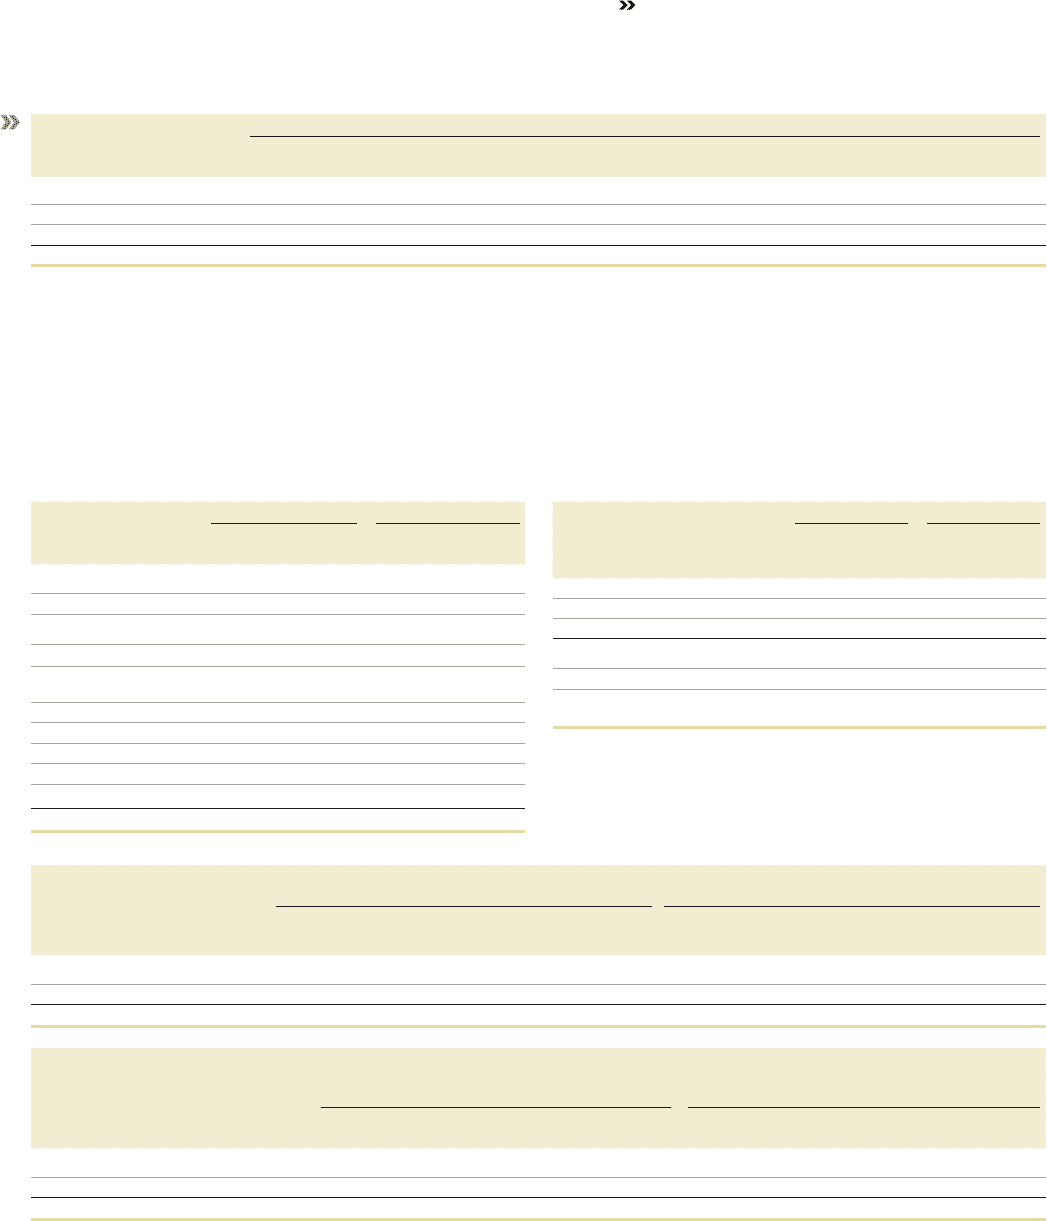
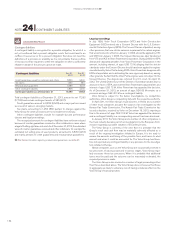
Long term incentive
program (share settled
plan version)
Shares granted conditional under the plan but not yet allotted (in thousand shares)
Vesting year Beginning of
the year Granted 2013 Cancelled/
forfeited 2013 Allotments
during 2013 End of the year Cost 2013
(SEK M)1
Year 2011 incentive program 2014/2015 2,208 0(67)(294)1,847 54.3
Year 2012 incentive program 2015/2016 1,320 0(36)(127)1,157 32.7
Year 2013 incentive program 2016/2017 0435 (17) 0 418 10.2
Total 3,528 435 (120) (421) 3,422 97.2
1 The fair value of the payments is determined based on the share price at the grant date reduced by the discounted value of expected dividends connected with the
share during the vesting period. The cost for the program is recognized over the vesting period. The cost includes social security cost.
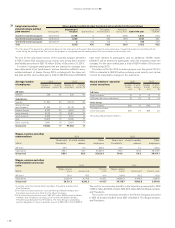
Average number
of employees
2013 2012
Number of
employees of which
women, % Number of
employees of which
women, %
AB Volvo
Sweden 262 45 236 44
Subsidiaries
Sweden 21,834 20 22,212 20
Western Europe
(excl. Sweden) 21,809 17 22,116 18
Eastern Europe 6,327 22 6,603 21
North America 16,175 18 16,481 18
South America 6,852 14 6,150 14
Asia 18,912 12 19,185 12
Other countries 2,661 15 2,670 17
Group total 94,832 17 95,653 17
Board members1 and other
senior executives
2013 2012
Number
at year-
end
of which
women,
%
Number
at year-
end
of which
women,
%
AB Volvo
Board members112 17 12 17
CEO and other senior executives 16 19 16 19
Volvo Group
Board members1580 17 680 14
Presidents and other
senior executives 695 19 878 20
1 Excluding deputy Board members.
The cost for the cash-based version of the incentive program amounted
to SEK 5 million (12) including social security cost during 2013, and the
total liability amounted to SEK 19 million (16) as of December 31, 2013.
A number of program participants that are leaving the company have
been determined to be “good leavers” and are therefore entitled to accu-
mulated allotment of shares. During 2013, including both the share set-
tled plan and the cash-settled plan, a total of 462,474 shares (250,922)
have been allotted to participants, and an additional 10,986 shares
(246,917) will be allotted to participants when the employees leave the
company. For the cash-settled plan, a total of SEK 4 million (1) has been
allotted during 2013.
The total cost for the 2013 incentive program over the period 2013 to
2016 is estimated to SEK 45 million including social security cost. Actual
cost will be impacted by changes in the share price.
Wages, salaries and other
remunerations 2013 2012
SEK M
Board and
Presidents1
of which variable
salaries
Other
employees
Board and
Presidents1
of which variable
salaries
Other
employees
AB Volvo 25.9 5.6 265.2 24.6 5.1 270.2
Subsidiaries 563.1 52.7 35,357.3 740.0 109.2 38,143.9
Group total 589.1 58.3 35,622.4 764.6 114.3 38,414.1
Wages, salaries and other
remunerations and social
costs 2013 2012
SEK M Wages, salaries
remun Social costs Pension
costs Wages, salaries
remun Social costs Pension costs
AB Volvo2291.1 87.3 91.6 294.8 90.2 82.9
Subsidiaries 35,920.4 8,174.9 4,052.1 38,883.9 9,595.6 3,881.9
Group total336,211.5 8,262.2 4,143.7 39,178.7 9,685.8 3,964.8
1 Including current and former Board members, Presidents and Executive
Vice Presidents.
2 The Parent Company’s pension costs, pertaining to Board members and
Presidents are disclosed in Note 3 in the Parent Company.
3 Of the Volvo Group’s pension costs, SEK 97.7 million (92.4) pertain to Board
members and Presidents, including current and former Board members,
Presidents and Executive Vice Presidents. The Volvo Group’s outstanding
pension obligations to these individuals amount to SEK 418.1 million (368.4).
The cost for non-monetary benefi ts in the Volvo Group amounted to SEK
1,960.3 million (2,100.0) of which SEK 50.5 million (66.1) to Board members
and Presidents.
The cost for non-monetary benefi ts in the Parent Company amounted
to SEK 15.2 million (12.8) of which SEK 1.8 million (1.7) to Board members
and Presidents.
158
FINANCIAL INFORMATION 2013