Volvo 2013 Annual Report Download - page 141
Download and view the complete annual report
Please find page 141 of the 2013 Volvo annual report below. You can navigate through the pages in the report by either clicking on the pages listed below, or by using the keyword search tool below to find specific information within the annual report.-
 1
1 -
2
-
3
-
4
-
5
-
6
-
7
-
8
-
9
-
10
-
11
-
12
-
13
-
14
-
15
-
16
-
17
-
18
-
19
-
20
-
21
-
22
-
23
-
24
-
25
-
26
-
27
-
28
-
29
-
30
-
31
-
32
-
33
-
34
-
35
-
36
-
37
-
38
-
39
-
40
-
41
-
42
-
43
-
44
-
45
-
46
-
47
-
48
-
49
-
50
-
51
-
52
-
53
-
54
-
55
-
56
-
57
-
58
-
59
-
60
-
61
-
62
-
63
-
64
-
65
-
66
-
67
-
68
-
69
-
70
-
71
-
72
-
73
-
74
-
75
-
76
-
77
-
78
-
79
-
80
-
81
-
82
-
83
-
84
-
85
-
86
-
87
-
88
-
89
-
90
-
91
-
92
-
93
-
94
-
95
-
96
-
97
-
98
-
99
-
100
-
101
-
102
-
103
-
104
-
105
-
106
-
107
-
108
-
109
-
110
-
111
-
112
-
113
-
114
-
115
-
116
-
117
-
118
-
119
-
120
-
121
-
122
-
123
-
124
-
125
-
126
-
127
-
128
-
129
-
130
-
 131
131 -
 132
132 -
 133
133 -
 134
134 -
 135
135 -
 136
136 -
 137
137 -
 138
138 -
 139
139 -
 140
140 -
 141
141 -
 142
142 -
 143
143 -
 144
144 -
 145
145 -
 146
146 -
 147
147 -
 148
148 -
 149
149 -
 150
150 -
 151
151 -
152
-
153
-
154
-
155
-
156
-
157
-
158
-
159
-
160
-
161
-
162
-
163
-
164
-
165
-
166
-
167
-
168
-
169
-
170
-
171
-
172
-
173
-
174
-
175
-
176
-
177
-
178
-
179
-
180
-
181
-
182
-
183
-
184
-
185
-
186
-
187
-
188
-
189
-
190
-
191
-
192
-
193
-
194
-
195
-
196
-
197
-
198
 |
 |

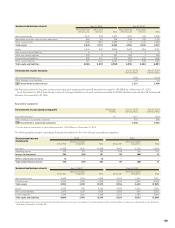
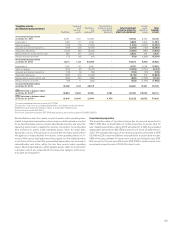
Intangible assets, acquisition costs Entrance fees,
industrial programs
Capitalized product
and software
development Other intangible
assets2Total intangible
assets Goodwill1
Acquisition cost as of Dec 31, 2011 22,588 224 29,737 6,148 58,697
Capital expenditures3–935,385225,500
Sales/scrapping – (14) (1,738) (11) (1,763)
Acquired and divested operations 588 (3,182) (2,109) 52 (4,651)
Translation differences (1,380) (11) (1,465) (550) (3,406)
Reclassifi ed to assets held for sale 297 3,198 1,958 60 5,513
Reclassifi cations and others – (19) (23) (80) (122)
Acquisition cost as of Dec 31, 2012 22,093 289 31,745 5,641 59,768
Capital expenditures3–1543,750513,955
Sales/scrapping – – (5) (18) (23)
Acquired and divested operations 21 – (3) (3) 15
Translation differences (734) 24 (790) (426) (1,926)
Reclassifi edfrom assets held for sale – – – – –
Reclassifi cations and other 32 48 (162) (132) (214)
Acquisition cost as of Dec 31, 2013 21,412 515 34,535 5,113 61,575
Accumulated amortization
and impairment Entrance fees,
industrial programs
Capitalized product
and software
development Other intangible
assets2Total intangible
assets Goodwill1
Accumulated amortization and impairment
as of Dec 31, 2011 – 33 18,331 2,555 20,919
Amortization and impairment5–552,7273523,134
Sales/scrapping – – (1,734) (11) (1,745)
Acquired and divested operations – (1,633) (547) (29) (2,209)
Translation differences – (1) (936) (173) (1,110)
Reclassifi ed to assets held for sale – 1,602 572 24 2,198
Reclassifi cations and other – (6) (38) (73) (117)
Accumulated amortization and impairment
as of Dec 31, 2012 – 50 18,375 2,645 21,070
Amortization and impairment5–183,2822973,597
Revaluation 1,458 – – – 1,458
Sales/scrapping – – (5) (11) (16)
Acquired and divested operations – – (3) (3) (6)
Translation differences – 4 (685) (118) (799)
Reclassifi edfrom assets held for sale – – – – –
Reclassifi cations and other – 48 (210) (155) (317)
Accumulated amortization and impairment
as of Dec 31, 2013 1,458 120 20,754 2,655 24,987
B/S Net value in balance sheet
as of December 31, 2012422,093 239 13,370 2,996 38,698
B/S Net value in balance sheet
as of December 31, 2013419,954 395 13,781 2,458 36,588
1 Includes on the date of IFRS adoption, costs of 14,184 and accumulated amortization of 3,863.
2 Other intangible assets mainly consist of trademarks and distribution networks.
3 Includes capitalized borrowing costs of 35 (295).
4 Costs less accumulated, amortization and impairments.
5 Of which impairments 4 (83).
Goodwill per Business Area Dec 31,
2013 Dec 31,
2012
Trucks 10,915 11,620
Construction Equipment 7,536 7,462
Buses 996 1,039
Volvo Rents – 1,469
Other business areas 507 503
Total goodwill value 19,954 22,093
137