Volvo 2013 Annual Report Download - page 171
Download and view the complete annual report
Please find page 171 of the 2013 Volvo annual report below. You can navigate through the pages in the report by either clicking on the pages listed below, or by using the keyword search tool below to find specific information within the annual report.-
 1
1 -
2
-
3
-
4
-
5
-
6
-
7
-
8
-
9
-
10
-
11
-
12
-
13
-
14
-
15
-
16
-
17
-
18
-
19
-
20
-
21
-
22
-
23
-
24
-
25
-
26
-
27
-
28
-
29
-
30
-
31
-
32
-
33
-
34
-
35
-
36
-
37
-
38
-
39
-
40
-
41
-
42
-
43
-
44
-
45
-
46
-
47
-
48
-
49
-
50
-
51
-
52
-
53
-
54
-
55
-
56
-
57
-
58
-
59
-
60
-
61
-
62
-
63
-
64
-
65
-
66
-
67
-
68
-
69
-
70
-
71
-
72
-
73
-
74
-
75
-
76
-
77
-
78
-
79
-
80
-
81
-
82
-
83
-
84
-
85
-
86
-
87
-
88
-
89
-
90
-
91
-
92
-
93
-
94
-
95
-
96
-
97
-
98
-
99
-
100
-
101
-
102
-
103
-
104
-
105
-
106
-
107
-
108
-
109
-
110
-
111
-
112
-
113
-
114
-
115
-
116
-
117
-
118
-
119
-
120
-
121
-
122
-
123
-
124
-
125
-
126
-
127
-
128
-
129
-
130
-
131
-
132
-
133
-
134
-
135
-
136
-
137
-
138
-
139
-
140
-
141
-
142
-
143
-
144
-
145
-
146
-
147
-
148
-
149
-
150
-
151
-
152
-
153
-
154
-
155
-
156
-
157
-
158
-
159
-
160
-
 161
161 -
 162
162 -
 163
163 -
 164
164 -
 165
165 -
 166
166 -
 167
167 -
 168
168 -
 169
169 -
 170
170 -
 171
171 -
 172
172 -
 173
173 -
 174
174 -
 175
175 -
 176
176 -
 177
177 -
 178
178 -
 179
179 -
 180
180 -
 181
181 -
182
-
183
-
184
-
185
-
186
-
187
-
188
-
189
-
190
-
191
-
192
-
193
-
194
-
195
-
196
-
197
-
198
 |
 |

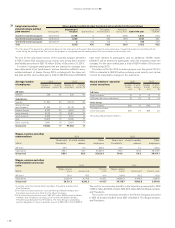
Income statement
full year, 2012 Volvo Group
SEK M
Previously
reported
2012
Restatement
joint ventures
After joint
venture
restatement
Restatement
post-
employment
benefi ts
After post-
employment
benefi t
restatement
Restatement
hedging of
fi r m fl o w s
After
restatements
Net sales 303,647 (3,833) 299,814 – 299,814 – 299,814
Cost of sales (235,085) 3,281 (231,804) 412 (231,392) (223) (231,615)
Gross income 68,562 (552) 68,010 412 68,422 (223) 68,199
Research and development expenses (14,794) 81 (14,713) 78 (14,635) – (14,635)
Selling expenses (28,248) 180 (28,068) 174 (27,894) – (27,894)
Administrative expenses (5,669) 88 (5,581) 18 (5,563) – (5,563)
Other operating income and expenses (2,160) 60 (2,100) 4 (2,096) – (2,096)
Income from investments in Joint
Venturesand associated companies (23) 122 99 – 99 – 99
Income from other investments (47) 5 (42) – (42) – (42)
Operating income 17,622 (17) 17,604 686 18,290 (223) 18,067
Interest income and similar credits 510 (57) 453 – 453 – 453
Interest expenses and similar charges (2,476) 20 (2,456) (493) (2,949) – (2,949)
Other fi nancial income and expenses (301) 0 (301) – (301) 223 (78)
Income after fi nancial items 15,355 (54) 15,301 193 15,494 0 15,494
Income taxes (4,097) 45 (4,052) (64) (4,116) – (4,116)
Income for the period 11,258 (9) 11,249 129 11,378 0 11,378
Consolidated other
comprehensive income
Income for the period 11,258 (9) 11,249 129 11,378 0 11,378
Exchange differences on translation
of foreign operations (3,916) 208 (3,708) 313 (3,395) – (3,395)
Share of OCI related to Joint Ventures and
associated companies – (191) (191) – (191) – (191)
Exchange differences on hedge
instruments of net investment
in foreign operations 0–0–0–0
Accumulated translation difference reversed
to income (118) – (118) – (118) – (118)
Available for sale investments (4)347343 –343 –343
Cash fl ow hedges 8–8–8–8
Remeasurements of defi ned benefi t plan – – – (2,234) (2,234) – (2,234)
Other comprehensive income,
net of income taxes (4,030) 364 (3,666) (1,921) (5,587) 0 (5,587)
Total comprehensive income
for the period 7,228 355 7,583 (1,792) 5,791 0 5,791
Attributable to
Equity holders of the parent company 7,092–––––5,655
Minority interests 136–––––136
7,228 – – – – – 5,791
167