Volvo 2013 Annual Report Download - page 55
Download and view the complete annual report
Please find page 55 of the 2013 Volvo annual report below. You can navigate through the pages in the report by either clicking on the pages listed below, or by using the keyword search tool below to find specific information within the annual report.-
 1
1 -
2
-
3
-
4
-
5
-
6
-
7
-
8
-
9
-
10
-
11
-
12
-
13
-
14
-
15
-
16
-
17
-
18
-
19
-
20
-
21
-
22
-
23
-
24
-
25
-
26
-
27
-
28
-
29
-
30
-
31
-
32
-
33
-
34
-
35
-
36
-
37
-
38
-
39
-
40
-
41
-
42
-
43
-
44
-
 45
45 -
 46
46 -
 47
47 -
 48
48 -
 49
49 -
 50
50 -
 51
51 -
 52
52 -
 53
53 -
 54
54 -
 55
55 -
 56
56 -
 57
57 -
 58
58 -
 59
59 -
 60
60 -
 61
61 -
 62
62 -
 63
63 -
 64
64 -
 65
65 -
66
-
67
-
68
-
69
-
70
-
71
-
72
-
73
-
74
-
75
-
76
-
77
-
78
-
79
-
80
-
81
-
82
-
83
-
84
-
85
-
86
-
87
-
88
-
89
-
90
-
91
-
92
-
93
-
94
-
95
-
96
-
97
-
98
-
99
-
100
-
101
-
102
-
103
-
104
-
105
-
106
-
107
-
108
-
109
-
110
-
111
-
112
-
113
-
114
-
115
-
116
-
117
-
118
-
119
-
120
-
121
-
122
-
123
-
124
-
125
-
126
-
127
-
128
-
129
-
130
-
131
-
132
-
133
-
134
-
135
-
136
-
137
-
138
-
139
-
140
-
141
-
142
-
143
-
144
-
145
-
146
-
147
-
148
-
149
-
150
-
151
-
152
-
153
-
154
-
155
-
156
-
157
-
158
-
159
-
160
-
161
-
162
-
163
-
164
-
165
-
166
-
167
-
168
-
169
-
170
-
171
-
172
-
173
-
174
-
175
-
176
-
177
-
178
-
179
-
180
-
181
-
182
-
183
-
184
-
185
-
186
-
187
-
188
-
189
-
190
-
191
-
192
-
193
-
194
-
195
-
196
-
197
-
198
 |
 |
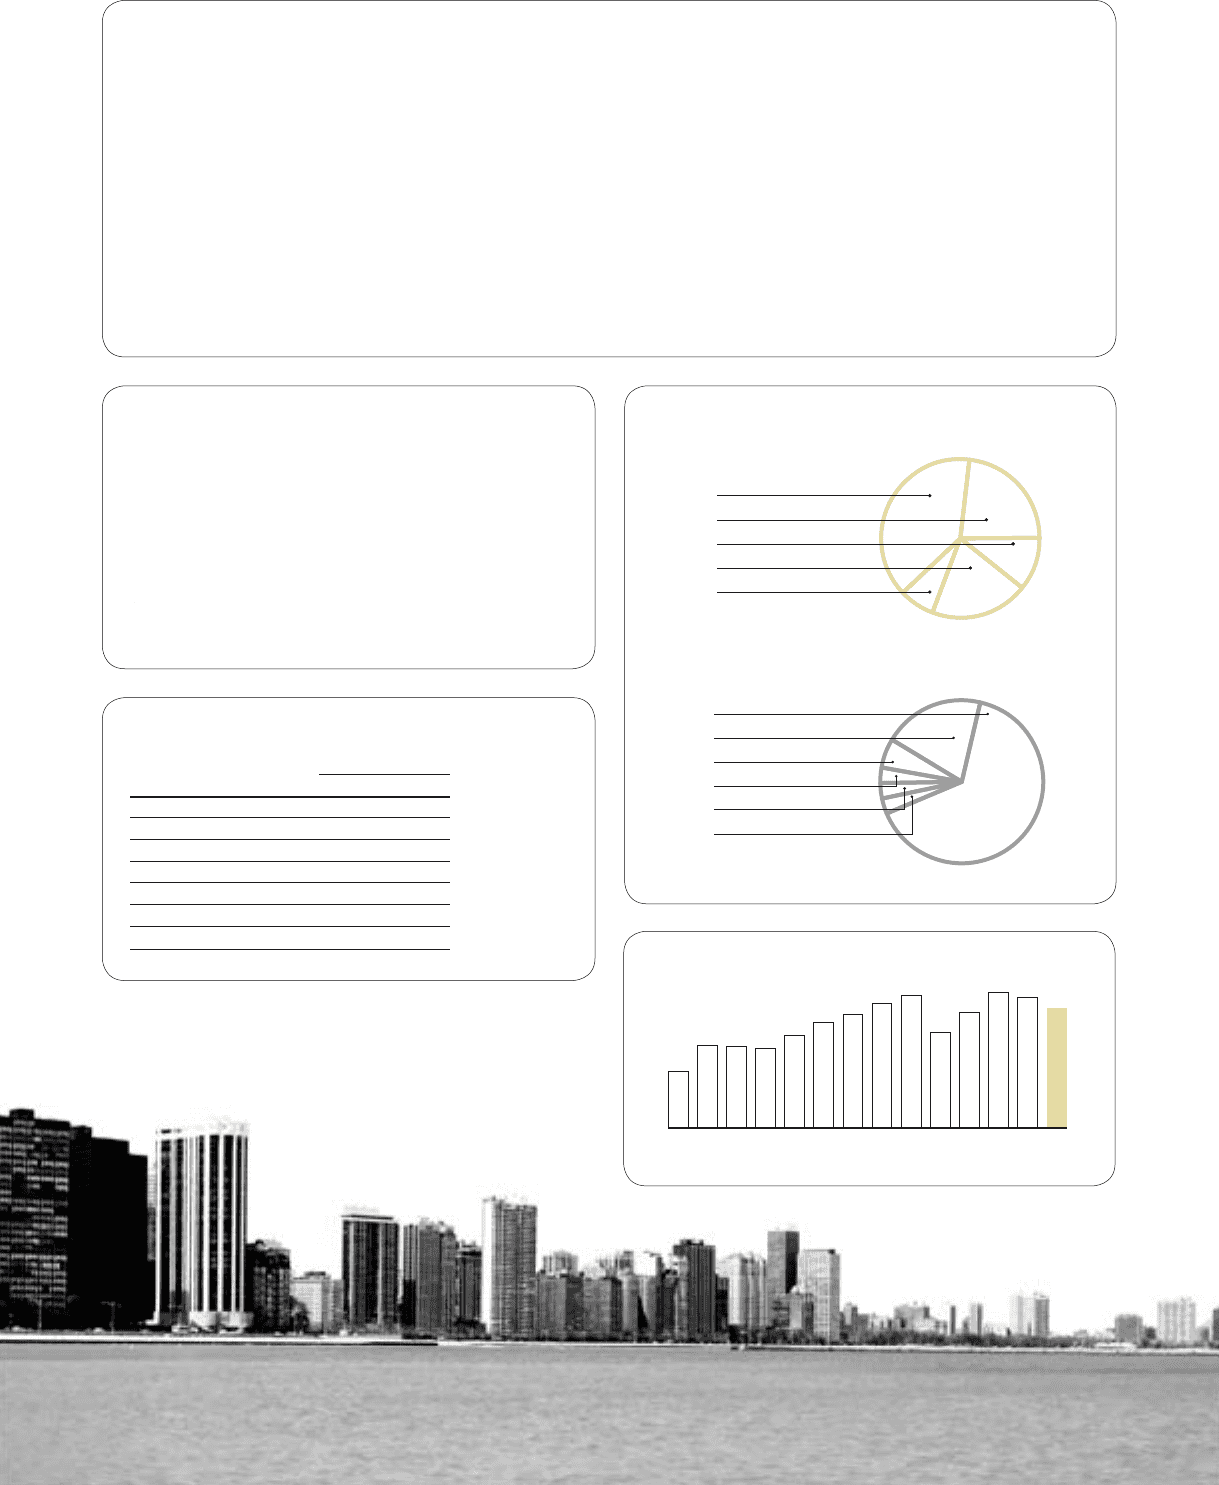
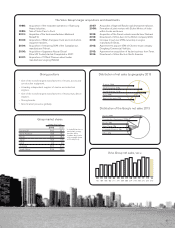
Group market shares
Heavy-duty trucks
2013 2012
Europe 30 24.3 25.7
North America 18.8 18.3
Brazil 20.0 18.2
Japan 18.7 17.5
India* 4.4 3.9
Australia 22.2 21.4
South Africa 23.9 23.5
* In India Eicher has a
particularly strong
position within
medium-duty trucks
with a market share
of 30.4% (31.4).
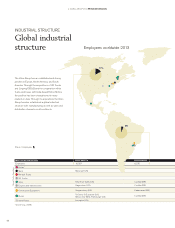
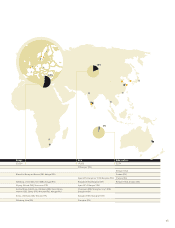
Distribution of net sales by geography 2013
Europe, 39%
North America, 23%
South America, 11%
Asia, 20%
Rest of the world, 7%
Trucks, 65%
Construction Equipment, 20%
Buses, 6%
Volvo Penta, 3%
Customer Finance, 3%
Other, 3%
Distribution of the Group’s net sales 2013
• One of the world’s lar
g
est manufacturers of trucks, buses and
cons
t
ruc
ti
on equ
i
pmen
t
.
•
A leading independent supplier of marine and industrial
eng
ines.
•
O
ne of the world’s lar
g
est manufacturers of heavy-duty diesel
en
gi
nes.
•Stron
g
brands.
•
G
ood market
p
resence globally.
Strong positions
The Volvo Group’s larger acquisitions and divestments
1998: Acquisition of the excavator operations of Samsung
Heavy Industries.
1999: Sale of Volvo Cars to Ford.
2001: Acquisition of the truck manufacturers Mack and
Renault VI.
2003: Acquisition of Bilia’s European truck and construction
equipment dealers.
2004: Acquisition of remaining 50% of the Canadian bus
manufacturer Prévost.
2006: Acquisition of Japanese Nissan Diesel
(Now UD Trucks) started. Completed in 2007.
2007: Acquisition of 70% of Chinese wheel loader
manufacturerLingong (SDLG).
2007: Acquisition of Ingersoll Rand’s road development division.
2008: Formation of joint venture with Eicher Motors of India
within trucks and buses.
2012: Acquisition of the French vehicle manufacturer Panhard.
2012: Divestment of Volvo Aero to the British company GKN.
2012: Increase to just over 25% ownership in engine
manufacturer Deutz.
2013: Agreement to acquire 45% of Chinese truck company
Dongfeng Commercial Vehicles.
2013: Agreement on acquisition of hauler business from Terex.
2014: Divestment of Volvo Rents in North America.
Volvo Group net sales, SEK bn
04 05 06 07 08 09 10 11 12 13
02 03
0100
130 189 186 183 211 241 259 285 304 218 265 310 300 273
51