Volvo 2013 Annual Report Download - page 185
Download and view the complete annual report
Please find page 185 of the 2013 Volvo annual report below. You can navigate through the pages in the report by either clicking on the pages listed below, or by using the keyword search tool below to find specific information within the annual report.-
 1
1 -
2
-
3
-
4
-
5
-
6
-
7
-
8
-
9
-
10
-
11
-
12
-
13
-
14
-
15
-
16
-
17
-
18
-
19
-
20
-
21
-
22
-
23
-
24
-
25
-
26
-
27
-
28
-
29
-
30
-
31
-
32
-
33
-
34
-
35
-
36
-
37
-
38
-
39
-
40
-
41
-
42
-
43
-
44
-
45
-
46
-
47
-
48
-
49
-
50
-
51
-
52
-
53
-
54
-
55
-
56
-
57
-
58
-
59
-
60
-
61
-
62
-
63
-
64
-
65
-
66
-
67
-
68
-
69
-
70
-
71
-
72
-
73
-
74
-
75
-
76
-
77
-
78
-
79
-
80
-
81
-
82
-
83
-
84
-
85
-
86
-
87
-
88
-
89
-
90
-
91
-
92
-
93
-
94
-
95
-
96
-
97
-
98
-
99
-
100
-
101
-
102
-
103
-
104
-
105
-
106
-
107
-
108
-
109
-
110
-
111
-
112
-
113
-
114
-
115
-
116
-
117
-
118
-
119
-
120
-
121
-
122
-
123
-
124
-
125
-
126
-
127
-
128
-
129
-
130
-
131
-
132
-
133
-
134
-
135
-
136
-
137
-
138
-
139
-
140
-
141
-
142
-
143
-
144
-
145
-
146
-
147
-
148
-
149
-
150
-
151
-
152
-
153
-
154
-
155
-
156
-
157
-
158
-
159
-
160
-
161
-
162
-
163
-
164
-
165
-
166
-
167
-
168
-
169
-
170
-
171
-
172
-
173
-
174
-
 175
175 -
 176
176 -
 177
177 -
 178
178 -
 179
179 -
 180
180 -
 181
181 -
 182
182 -
 183
183 -
 184
184 -
 185
185 -
 186
186 -
 187
187 -
 188
188 -
 189
189 -
 190
190 -
 191
191 -
 192
192 -
 193
193 -
 194
194 -
 195
195 -
196
-
197
-
198
 |
 |

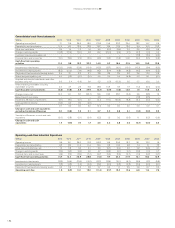
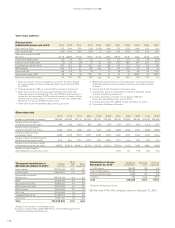
Eleven-year Summary
The eleven-year summary presents each year in accordance with the
Generally Accepted Accounting Practice (GAAP) for that year. Earlier
years are not restated when new accounting standards are applied. The
years 2001–2003 are accounted for in accordance with Swedish GAAP
for the respective year. As from 2004 the reporting is based on IFRS. The
transition to IFRS is described in Note 3 in the 2005 and 2006 Annual
Reports. As from January 1, 2007, the benefi ts from the synergies created
in the business units are transferred back to the product areas. Also, as
from January 1, 2007, the responsibility for the Group’s treasury operations
and real estate has been transferred from Volvo Financial Services, which,
as from January 1, 2007, only are consolidated in accordance with the
purchase method. Comparison fi gures for 2006 have been recalculated.
Consolidated income statements
SEK M 2013 2012 2011 2010 2009 2008 2007 2006 2005 2004 2003
Net sales 272,622 303,647 310,367 264,749 218,361 303,667 285,405 258,835 240,559 211,076 183,291
Cost of sales (212,504) (235,085) (235,104) (201,797) (186,167) (237,578) (219,600) (199,054) (186,662) (164,170) (146,879)
Gross income 60,118 68,562 75,263 62,952 32,194 66,089 65,805 59,781 53,897 46,906 36,412
Research and development
expenses (15,124) (14,794) (13,276) (12,970) (13,193) (14,348) (11,059) (8,354) (7,557) (7,614) (6,829)
Selling expenses (28,506) (28,248) (26,001) (24,149) (25,334) (27,129) (26,068) (21,213) (20,778) (19,369) (16,866)
Administrative expenses (5,862) (5,669) (7,132) (5,666) (5,863) (6,940) (7,133) (6,551) (6,301) (5,483) (5,467)
Other operating income
and expenses (3,554) (2,160) (1,649) (2,023) (4,798) (1,915) 163 (3,466) (588) (618) (1,367)
Income from investments
in joint ventures and
associated companies 96 (23) (81) (86) (14) 25 430 61 (557) 27 200
Income from other investments (30) (47) (225) (58) (6) 69 93 141 37 830 (3,579)
Operating income 7,13 8 17,622 26 , 899 18,000 (17,013) 15,851 22,231 20,399 18,153 14,679 2 ,50 4
Interest income
and similar credits 381 510 608 442 390 1,171 952 666 654 821 1,096
Interest expenses
and similar charges (2,810) (2,476) (2,875) (3,142) (3,559) (1,935) (1,122) (585) (972) (1,254) (1,888)
Other fi nancial income
and expenses 11 (301) 297 213 (392) (1,077) (504) (181) 181 (1,210) (55)
Income after fi nancial items 4,721 15,355 24,929 15,514 (20,573) 14,010 21,557 20,299 18,016 13,036 1,657
Income taxes (919) (4,097) (6,814) (4,302) 5,889 (3,994) (6,529) (3,981) (4,908) (3,129) (1,334)
Income for the period 3,802 11,258 18,115 11,212 (14,685) 10,016 15,028 16,318 13,108 9,907 323
Attributable to:
Equity holders of the
Parent Company 3,583 11,039 17,751 10,866 (14,718) 9,942 14,932 16,268 13,054 9,867 298
Minority interest 219 219 364 346 33 74 96 50 54 40 25
3,802 11,258 18,115 11,212 (14,685) 10,016 15,028 16,318 13,108 9,907 323
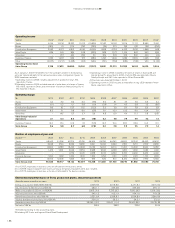
Consolidated income statements Industrial Operations
SEK M 2013 2012 2011 2010 2009 2008 2007 2006 2005 2004 2003
Net sales 265,420 296,031 303,589 257,375 208,487 294,932 276,795 249,020 231,191 202,171 174,768
Cost of sales (209,307) (231,216) (233,097) (197,480) (179,578) (232,247) (214,160) (192,400) (180,823) (158,453) (141,256)
Gross income 56,113 64,815 70,492 59,895 28,909 62,685 62,635 56,620 50,368 43,718 33,512
Research and development
expenses (15,124) (14,794) (13,276) (12,970) (13,193) (14,348) (11,059) (8,354) (7,557) (7,614) (6,829)
Selling expenses (26,904) (26,582) (25,181) (22,649) (23,752) (25,597) (24,671) (19,999) (19,616) (18,317) (15,891)
Administrative expenses (5,824) (5,639) (4,753) (5,640) (5,838) (6,921) (7,092) (6,481) (6,147) (5,310) (5,259)
Other operating income
and expenses (2,710) (1,600) (1,045) (659) (2,432) (1,457) 249 (3,275) (397) 7 (540)
Income from Volvo Financial
Services ––––––––2,0331,365926
Income from investments
in joint ventures andassociated
companies 96 (23) (82) (86) (15) 23 428 61 (568) 2 166
Income from other investments (31) (46) (225) (57) (13) 69 93 141 37 828 (3,581)
Operating income 5,616 16,130 25,930 17,834 (16,333) 14,454 20,583 18,713 18,153 14,679 2,504
181