Volvo 2013 Annual Report Download - page 142
Download and view the complete annual report
Please find page 142 of the 2013 Volvo annual report below. You can navigate through the pages in the report by either clicking on the pages listed below, or by using the keyword search tool below to find specific information within the annual report.-
 1
1 -
2
-
3
-
4
-
5
-
6
-
7
-
8
-
9
-
10
-
11
-
12
-
13
-
14
-
15
-
16
-
17
-
18
-
19
-
20
-
21
-
22
-
23
-
24
-
25
-
26
-
27
-
28
-
29
-
30
-
31
-
32
-
33
-
34
-
35
-
36
-
37
-
38
-
39
-
40
-
41
-
42
-
43
-
44
-
45
-
46
-
47
-
48
-
49
-
50
-
51
-
52
-
53
-
54
-
55
-
56
-
57
-
58
-
59
-
60
-
61
-
62
-
63
-
64
-
65
-
66
-
67
-
68
-
69
-
70
-
71
-
72
-
73
-
74
-
75
-
76
-
77
-
78
-
79
-
80
-
81
-
82
-
83
-
84
-
85
-
86
-
87
-
88
-
89
-
90
-
91
-
92
-
93
-
94
-
95
-
96
-
97
-
98
-
99
-
100
-
101
-
102
-
103
-
104
-
105
-
106
-
107
-
108
-
109
-
110
-
111
-
112
-
113
-
114
-
115
-
116
-
117
-
118
-
119
-
120
-
121
-
122
-
123
-
124
-
125
-
126
-
127
-
128
-
129
-
130
-
131
-
 132
132 -
 133
133 -
 134
134 -
 135
135 -
 136
136 -
 137
137 -
 138
138 -
 139
139 -
 140
140 -
 141
141 -
 142
142 -
 143
143 -
 144
144 -
 145
145 -
 146
146 -
 147
147 -
 148
148 -
 149
149 -
 150
150 -
 151
151 -
 152
152 -
153
-
154
-
155
-
156
-
157
-
158
-
159
-
160
-
161
-
162
-
163
-
164
-
165
-
166
-
167
-
168
-
169
-
170
-
171
-
172
-
173
-
174
-
175
-
176
-
177
-
178
-
179
-
180
-
181
-
182
-
183
-
184
-
185
-
186
-
187
-
188
-
189
-
190
-
191
-
192
-
193
-
194
-
195
-
196
-
197
-
198
 |
 |

Tangible assets
The Volvo Group applies the cost method for measurement of tangible
assets. Borrowing costs are included in the acquisition value of assets
that is expected to take more than 12 months to complete for their intended
use or sale, so called qualifying assets.
Investment properties are properties owned for the purpose of obtaining
rental income and/or appreciation in value. Investment properties are rec-
ognized at cost. Information regarding the estimated fair value of invest-
ment properties is based on an internal discounted cash fl ow projections.
The required return is based on current property market conditions for com-
parable properties in comparable locations. The applied valuation method
is classifi ed as level 3 as per the fair value hierarchy in IFRS 13 and there
have not been any changes in valuation method during the year.
Depreciation and impairment
Property, plant and equipment are depreciated over their useful lives.
Useful lives are based on estimates of the period over which the assets
will generate revenue.
Depreciation is recognized on a straight-line basis based on the cost of
the assets, adjusted in appropriate cases by impairments, and estimated
useful lives. Depreciation is recognized in the respective function to which
it belongs. Impairment tests for depreciable non-current assets are per-
formed if there are indications of impairment at the balance-sheet date.
Depreciation periods
Type-specifi c tools 2 to 8 years
Assets under operating leases 3 to 5 years
Machinery 5 to 20 years
Buildings and investment properties 25 to 50 years
Land improvements 20 years
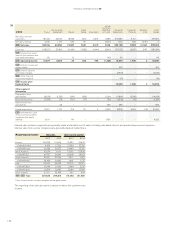
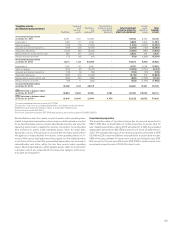
Tangible assets,
Acquisition cost
Buildings
Land and
land
improve-
ments
Machinery
and equip-
ment3
Construction in
progress, including
advance payments
Total investment
property, property,
plant and equipment
Assets
under
operating
leases
Total
tangible
assets
Acquisition costs as of Dec 31, 2011 31,941 13,221 70,184 6,230 121,576 32,565 154,141
Capital expenditures1794 344 3,037 5,024 9,199 9,986 19,185
Sales/scrapping (234) (32) (2,115) (13) (2,394) (5,229) (7,623)
Acquired and divested operations (661) (9) (4,244) (92) (5,006) 69 (4,937)
Translation differences (1,762) (1,273) (3,825) (159) (7,019) (1,438) (8,457)
Reclassifi edfrom assets held for sale 706 49 4,584 57 5,396 219 5,615
Reclassifi cations and other 1,211 253 1,853 (3,560) (243) 2,196 1,953
Acquisition costs as of Dec 31, 2012 31,995 12,553 69,474 7,487 121,509 38,368 159,877
Capital expenditures1649 86 1,753 5,967 8,455 8,262 16,717
Sales/scrapping (372) (40) (3,291) (21) (3,724) (5,847) (9,571)
Acquired and divested operations (65) (98) (74) 8 (229) (227) (456)
Translation differences (1,252) (1,176) (2,435) (137) (5,000) 495 (4,505)
Reclassifi edto assets held for sale (1,309) (289) (857) (45) (2,500) (6,855) (9,355)
Reclassifi cations and other 1,229 128 6,529 (8,483) (597) 1,527 930
Acquisition costs as of Dec 31, 2013 30,875 11,164 71,099 4,776 117,914 35,723 153,637
ACCOUNTING POLICIES
SOURCES OF ESTIMATION UNCERTAINTY
!
Impairment of tangible assets
If, at the balance-sheet date, there is any indication that a tangible asset
has been impaired, the recoverable amount of the asset should be esti-
mated. The recoverable amount is the higher of the asset’s net selling
price and its value in use, estimated with reference to management’s pro-
jections of future cash fl ows. If the recoverable amount of the asset is less
than the carrying amount, an impairment loss is recognized and the carry-
ing amount of the asset is reduced to the recoverable amount. Determina-
tion of the recoverable amount is based upon management’s projections
of future cash fl ows, which are generally made by use of internal business
plans or forecasts. While management believes that estimates of future
cash fl ows are reasonable, different assumptions regarding such cash
fl ows could materially affect valuations.
NOTE 13 TANGIBLE ASSETS
138
FINANCIAL INFORMATION 2013