Volvo 2013 Annual Report Download - page 135
Download and view the complete annual report
Please find page 135 of the 2013 Volvo annual report below. You can navigate through the pages in the report by either clicking on the pages listed below, or by using the keyword search tool below to find specific information within the annual report.-
 1
1 -
2
-
3
-
4
-
5
-
6
-
7
-
8
-
9
-
10
-
11
-
12
-
13
-
14
-
15
-
16
-
17
-
18
-
19
-
20
-
21
-
22
-
23
-
24
-
25
-
26
-
27
-
28
-
29
-
30
-
31
-
32
-
33
-
34
-
35
-
36
-
37
-
38
-
39
-
40
-
41
-
42
-
43
-
44
-
45
-
46
-
47
-
48
-
49
-
50
-
51
-
52
-
53
-
54
-
55
-
56
-
57
-
58
-
59
-
60
-
61
-
62
-
63
-
64
-
65
-
66
-
67
-
68
-
69
-
70
-
71
-
72
-
73
-
74
-
75
-
76
-
77
-
78
-
79
-
80
-
81
-
82
-
83
-
84
-
85
-
86
-
87
-
88
-
89
-
90
-
91
-
92
-
93
-
94
-
95
-
96
-
97
-
98
-
99
-
100
-
101
-
102
-
103
-
104
-
105
-
106
-
107
-
108
-
109
-
110
-
111
-
112
-
113
-
114
-
115
-
116
-
117
-
118
-
119
-
120
-
121
-
122
-
123
-
124
-
 125
125 -
 126
126 -
 127
127 -
 128
128 -
 129
129 -
 130
130 -
 131
131 -
 132
132 -
 133
133 -
 134
134 -
 135
135 -
 136
136 -
 137
137 -
 138
138 -
 139
139 -
 140
140 -
 141
141 -
 142
142 -
 143
143 -
 144
144 -
 145
145 -
146
-
147
-
148
-
149
-
150
-
151
-
152
-
153
-
154
-
155
-
156
-
157
-
158
-
159
-
160
-
161
-
162
-
163
-
164
-
165
-
166
-
167
-
168
-
169
-
170
-
171
-
172
-
173
-
174
-
175
-
176
-
177
-
178
-
179
-
180
-
181
-
182
-
183
-
184
-
185
-
186
-
187
-
188
-
189
-
190
-
191
-
192
-
193
-
194
-
195
-
196
-
197
-
198
 |
 |

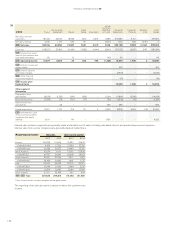
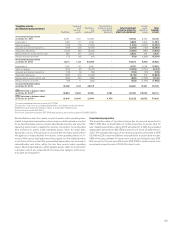
The Trucks operations is structured according to a functional approach,
whereby the entire Trucks business is managed as one single business
area consisting of five different functional organizations: Group Trucks Sales
& Marketing EMEA (Europe, Middle East, Africa), Group Trucks Sales &
Marketing Americas, Group Trucks Sales & Marketing and JV’s APAC (Asia
Pacific), Group Trucks Operations and Group Trucks Technology. Business
areas Buses, Construction Equipment, Volvo Penta and Customer Finance
are separate business areas. Governmental Sales and Volvo Rents are
treated as separate business areas, but are included in Group function
and other segment. The Volvo Group is thereby organized in seven busi-
ness areas. Volvo Rents was divested on January 31, 2014.
The Group have shared operations in both Group Trucks and Group
functions and other. Purchasing, powertrain, logistics and parts operations
are part of Group Trucks segment. Volvo IT, Group Business Services and
Volvo Real Estate are treated as business support functions and included
in Group functions and other segment. The cost of these operations is
shared between the different business areas based on utilization accord-
ing to the principles of the financial framework set by the Volvo Group.
2013 Trucks
Con-
struction
Equipment Buses Volvo
Penta
Group
functions and
other incl. elim. Industrial
Operations Customer
Finance Eliminations Volvo
Group
Net sales, external
customers 176 ,503 52,770 16,267 7,343 10,889 263,772 8,850 – 272,622
Net sales, internal 1,971 667 440 207 (1,637) 1,648 689 (2,337) 0
I/S Net sales 178 ,474 53,437 16,707 7,550 9,252 265,421 9,539 (2,337) 272,622
Expenses (172,397) (50,846) (16,910) (6,924) (12,824) (259, 901) (8,017) 2,337 (265,580)
I/S Income from
investments in joint ventures
and associated companies 68 –14 –14 96 – – 96
I/S Operating income 6,145 2,592 (190) 626 (3,557) 5,616 1,522 07,138
I/S Interest income
and similar credits 381 – – 381
I/S Interest expense
and similar charges (2,810) – – (2,810)
I/S Other financial
income and expense 11 – – 11
I/S Income after financial
items 3,199 – – 4,721
Other segment
information
Depreciation and
amortization (9,461) (2,049) (376) (307) (2,279) (14,472) (2,949) (17,422)
Restructuring costs (667) (5) 22 –(53) (702) (5) (707)
Gains/losses from
divestments 115 100 – – (1,572) (1,357) (3) (1,360)
Capital expenditure 8,753 2,475 386 254 2,025 13,892 6,832 (52) 20,672
B/S Investments in joint
ventures and associated
companies (the equity
method) 2,406 –165 29 1,776 4,377 – – 4,377
B/S Assets held for sale
(total assets) 8,104 – – 8,104
B/S Assets held for sale
(total liabilities) (350) – – (350)
NOTE 6 SEGMENT REPORTING
131