Volvo 2013 Annual Report Download - page 112
Download and view the complete annual report
Please find page 112 of the 2013 Volvo annual report below. You can navigate through the pages in the report by either clicking on the pages listed below, or by using the keyword search tool below to find specific information within the annual report.-
 1
1 -
2
-
3
-
4
-
5
-
6
-
7
-
8
-
9
-
10
-
11
-
12
-
13
-
14
-
15
-
16
-
17
-
18
-
19
-
20
-
21
-
22
-
23
-
24
-
25
-
26
-
27
-
28
-
29
-
30
-
31
-
32
-
33
-
34
-
35
-
36
-
37
-
38
-
39
-
40
-
41
-
42
-
43
-
44
-
45
-
46
-
47
-
48
-
49
-
50
-
51
-
52
-
53
-
54
-
55
-
56
-
57
-
58
-
59
-
60
-
61
-
62
-
63
-
64
-
65
-
66
-
67
-
68
-
69
-
70
-
71
-
72
-
73
-
74
-
75
-
76
-
77
-
78
-
79
-
80
-
81
-
82
-
83
-
84
-
85
-
86
-
87
-
88
-
89
-
90
-
91
-
92
-
93
-
94
-
95
-
96
-
97
-
98
-
99
-
100
-
101
-
 102
102 -
 103
103 -
 104
104 -
 105
105 -
 106
106 -
 107
107 -
 108
108 -
 109
109 -
 110
110 -
 111
111 -
 112
112 -
 113
113 -
 114
114 -
 115
115 -
 116
116 -
 117
117 -
 118
118 -
 119
119 -
 120
120 -
 121
121 -
 122
122 -
123
-
124
-
125
-
126
-
127
-
128
-
129
-
130
-
131
-
132
-
133
-
134
-
135
-
136
-
137
-
138
-
139
-
140
-
141
-
142
-
143
-
144
-
145
-
146
-
147
-
148
-
149
-
150
-
151
-
152
-
153
-
154
-
155
-
156
-
157
-
158
-
159
-
160
-
161
-
162
-
163
-
164
-
165
-
166
-
167
-
168
-
169
-
170
-
171
-
172
-
173
-
174
-
175
-
176
-
177
-
178
-
179
-
180
-
181
-
182
-
183
-
184
-
185
-
186
-
187
-
188
-
189
-
190
-
191
-
192
-
193
-
194
-
195
-
196
-
197
-
198
 |
 |

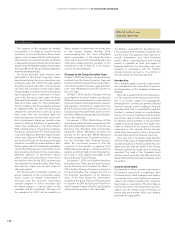
For the Volvo Group, the year 2013 was characterized by the most extensive product renewal in the history
of the Group, with associated costs in manufacturing, sales, administration and research and development,
as well as costs connected to restructuring primarily within the truck operations. Net sales amounted to
SEK 273 billion and operating income to SEK 7.1 billion.
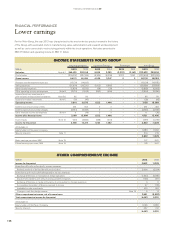
FINANCIAL PERFORMANCE
Lower earnings
INCOME STATEMENTS VOLVO GROUP
Industrial operations Customer Finance Eliminations Volvo Group
SEK M 2013 2012 2013 2012 2013 2012 2013 2012
Net sales Note 6,7 265,420 292,198 9,539 9,783 (2,337) (2,167) 272,622 299,814
Cost of sales (209,307) (227,745) (5,534) (6,036) 2,337 2,167 (212,504) (231,615)
Gross income 56,113 64,454 4,005 3,747 0 0 60,118 68,199
Research and development expenses (15,124) (14,635) – – – – (15,124) (14,635)
Selling expenses (26,904) (26,230) (1,602) (1,665) – – (28,506) (27,894)
Administrative expenses (5,824) (5,535) (38) (29) – – (5,862) (5,563)
Other operating income and expenses Note 8 (2,710) (1,538) (843) (556) – – (3,554) (2,096)
Income (loss) from investments in
joint ventures and associated companies Note 5,6 96 99 – – – – 96 99
Income from other investments Note 5 (31) (42) – – – – (30) (42)
Operating income 5,616 16,573 1,522 1,496 – – 7,138 18,069
Interest income and similar credits 381 453 0 0 – – 381 453
Interest expenses and similar charges (2,810) (2,949) 0 0 – – (2,810) (2,949)
Other fi nancial income and expenses Note 9 11 (78) 0 0 – – 11 (78)
Income after fi nancial items 3,199 13,999 1,522 1,496 – – 4,721 15,495
Income taxes Note 10 (451) (3,682) (468) (434) – – (919) (4,116)
Income for the period 2,748 10,317 1,054 1,062 – – 3,802 11,378
Attributable to:
Equity holders of the parent company 3,583 11,160
Minority interests Note 11219219
3,80211,378
Basic earnings per share, SEK Note 19 1.77 5.61
Diluted earnings per share, SEK Note 19 1.76 5.61
OTHER COMPREHENSIVE INCOME
SEK M 2013 2012
Income for the period 3,802 11,378
Items that will not be reclassifi ed to income statement:
Remeasurements of defi ned benefi t pension plans 3,904 (2,234)
Items that may be reclassifi ed subsequently to income statement:
Exchange differences on translation of foreign operations (1,634) (3,395)
Share of OCI related to joint ventures and associated companies (135) (191)
Exchange differences on hedge instruments of net investment in foreign operations 0 0
Accumulated translation difference reversed to income 37 (118)
Available-for-sale investments 470 343
Change in cash fl ow hedge reserve Note 19 9 8
Other comprehensive income, net of income taxes 2,651 (5,587)
Total comprehensive income for the period 6,453 5,791
Attributable to:
Equity holders of the Parent Company 6,196 5,655
Minority interests 257 136
6,453 5,791
108
FINANCIAL INFORMATION 2013
108