Volvo 2013 Annual Report Download - page 132
Download and view the complete annual report
Please find page 132 of the 2013 Volvo annual report below. You can navigate through the pages in the report by either clicking on the pages listed below, or by using the keyword search tool below to find specific information within the annual report.-
 1
1 -
2
-
3
-
4
-
5
-
6
-
7
-
8
-
9
-
10
-
11
-
12
-
13
-
14
-
15
-
16
-
17
-
18
-
19
-
20
-
21
-
22
-
23
-
24
-
25
-
26
-
27
-
28
-
29
-
30
-
31
-
32
-
33
-
34
-
35
-
36
-
37
-
38
-
39
-
40
-
41
-
42
-
43
-
44
-
45
-
46
-
47
-
48
-
49
-
50
-
51
-
52
-
53
-
54
-
55
-
56
-
57
-
58
-
59
-
60
-
61
-
62
-
63
-
64
-
65
-
66
-
67
-
68
-
69
-
70
-
71
-
72
-
73
-
74
-
75
-
76
-
77
-
78
-
79
-
80
-
81
-
82
-
83
-
84
-
85
-
86
-
87
-
88
-
89
-
90
-
91
-
92
-
93
-
94
-
95
-
96
-
97
-
98
-
99
-
100
-
101
-
102
-
103
-
104
-
105
-
106
-
107
-
108
-
109
-
110
-
111
-
112
-
113
-
114
-
115
-
116
-
117
-
118
-
119
-
120
-
121
-
 122
122 -
 123
123 -
 124
124 -
 125
125 -
 126
126 -
 127
127 -
 128
128 -
 129
129 -
 130
130 -
 131
131 -
 132
132 -
 133
133 -
 134
134 -
 135
135 -
 136
136 -
 137
137 -
 138
138 -
 139
139 -
 140
140 -
 141
141 -
 142
142 -
143
-
144
-
145
-
146
-
147
-
148
-
149
-
150
-
151
-
152
-
153
-
154
-
155
-
156
-
157
-
158
-
159
-
160
-
161
-
162
-
163
-
164
-
165
-
166
-
167
-
168
-
169
-
170
-
171
-
172
-
173
-
174
-
175
-
176
-
177
-
178
-
179
-
180
-
181
-
182
-
183
-
184
-
185
-
186
-
187
-
188
-
189
-
190
-
191
-
192
-
193
-
194
-
195
-
196
-
197
-
198
 |
 |

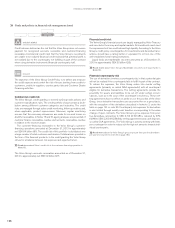
Subsidiaries
The Volvo Group has production facilities in 18 countries and sales of prod-
ucts in more than 190 markets which mean that the Volvo Group has sub-
sidiaries in many parts of the world. A subsidiary is defined as an entity that
is controlled by the Volvo Group. A subsidiary is controlled by a parent com-
pany when it has power over the investee, exposure, or rights, to variable
returns from its involvement with the investee and the ability to use its
power over the investee to affect the amount of the investor’s return. Most
of the Volvo Group’s subsidiaries are owned to 100% by the Volvo Group
and are therefore considered to be controlled by the Volvo Group. For some
subsidiaries there are restrictions on the Volvo Group’s ability to access or
use cash from these subsidiaries, for more information on cash that is not
available or with other limitations see note 18.
Read more about minority interests in N ote 11. For more information about
the composition of the Volvo Group see Note 13 for the parent company.
Joint ventures
Joint ventures are companies over which the Volvo Group has controlling
influence together with one or more external parties. Joint ventures are as
from January 1, 2013, recognized by applying equity accounting, in accord-
ance with IFRS 11 Joint arrangements. Joint ventures were previously rec-
ognized by applying the proportionate consolidation method. All three joint
ventures owned by the Volvo Group are of business related nature.
Read more about changes in the Volvo Group’s accounting for Joint Ventures
as from January 1, 2013 in Note 31.
Associated companies
Associated companies are companies in which the Volvo Group has a sig-
nificant influence, normally when the Group’s holdings equal at least 20%
but less than 50% of the voting rights. Holdings in associated companies
are recognized in accordance with the equity method.
Equity method
The Volvo Group’s share of income in companies recognized according to
the equity method is included in the consolidated income statement under
Income (loss) from investments in joint ventures and associated compa-
nies, less, where appropriate, depreciation of surplus values and the effect
of applying different accounting policies. Income from companies recog-
nized in accordance with the equity method is included in operating income
since the Volvo Group’s investments are of operating nature. For practical
reasons, some of the associated companies are included in the consoli-
dated financial statements with a certain time lag, normally one quarter.
Dividends from joint ventures and associated companies are not included
in consolidated income. In the consolidated balance sheet, investments in
joint ventures and associated companies are affected by the Volvo Group’s
share of the company’s net income, less depreciation of surplus values
and dividends received.
Other shares and participations
Holding of shares that do not provide the Volvo Group with significant in-
fluence, which generally means that Volvo Group’s holding of shares cor-
responds to less than 20% of the votes, are recognized as other shares
and participations. For listed shares, the carrying amount is equivalent to the
market value. Unlisted shares and participations, for which a fair value can-
not reasonably be determined, are measured at cost less any impairment.
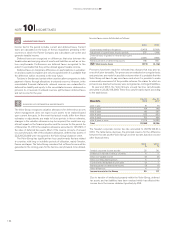
Joint ventures
The Volvo Group’s investments in joint ventures are listed below.
Shares in joint ventures Dec 31, 2013 Dec 31, 2012
Holding percentage Holding percentage
Shanghai Sunwin Bus Corp., China 50 50
DONGVO Truck Co., Ltd. (former
Dong Feng Nissan Diesel Motor
Co., Ltd.,) China 50 50
VE Commercial Vehicles, Ltd., India145.6 45.6
1 VE Commercial Vehicles (VECV) is considered to be a joint venture as Volvo Group
and Eicher Motors Ltd have signed an agreement which states that common
agreement is needed in relation to important questions related to the govern-
ance of VECV. Read more in Note 31 regarding changes in the Volvo Group’s
financial reporting 2013.
ACCOUNTING POLICIES
INVESTMENTS IN JOINT VENTURES, ASSOCIATED
COMPANIES AND OTHER SHARES AND PARTICIPATIONS
NOTE 5
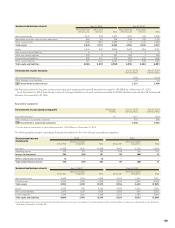
The following tables present summarized financial information for the Volvo Group’s joint ventures:
Summarized income statements 2013 2012
VE Commercial
Vehicles, Ltd. Other joint
ventures Total VE Commercial
Vehicles, Ltd. Other joint
ventures Total
Net sales 5,516 1,291 6,807 6,604 1,803 8,407
Operating income1342 (52) 290 440 (10) 430
Interest income and similar credits 60 161 113 1114
Interest expense and similar charges (10) (39) (49) (6) (34) (40)
Other financial income and expenses (2) (1) (3) 0(1) (1)
Income taxes (84) (5) (89) (140) 4(136)
Income for the period 306 (96) 210 407 (40) 367
Other comprehensive income (298) 12 (286) (221) (26) (247)
Total comprehensive income 8(84) (76) 186 (66) 120
1 Depreciation and amortization of 138 (112) are included within operating income.
128
FINANCIAL INFORMATION 2013
128