Volvo 2013 Annual Report Download - page 5
Download and view the complete annual report
Please find page 5 of the 2013 Volvo annual report below. You can navigate through the pages in the report by either clicking on the pages listed below, or by using the keyword search tool below to find specific information within the annual report.-
 1
1 -
 2
2 -
 3
3 -
 4
4 -
 5
5 -
 6
6 -
 7
7 -
 8
8 -
 9
9 -
 10
10 -
 11
11 -
 12
12 -
 13
13 -
 14
14 -
 15
15 -
 16
16 -
17
-
18
-
19
-
20
-
21
-
22
-
23
-
24
-
25
-
26
-
27
-
28
-
29
-
30
-
31
-
32
-
33
-
34
-
35
-
36
-
37
-
38
-
39
-
40
-
41
-
42
-
43
-
44
-
45
-
46
-
47
-
48
-
49
-
50
-
51
-
52
-
53
-
54
-
55
-
56
-
57
-
58
-
59
-
60
-
61
-
62
-
63
-
64
-
65
-
66
-
67
-
68
-
69
-
70
-
71
-
72
-
73
-
74
-
75
-
76
-
77
-
78
-
79
-
80
-
81
-
82
-
83
-
84
-
85
-
86
-
87
-
88
-
89
-
90
-
91
-
92
-
93
-
94
-
95
-
96
-
97
-
98
-
99
-
100
-
101
-
102
-
103
-
104
-
105
-
106
-
107
-
108
-
109
-
110
-
111
-
112
-
113
-
114
-
115
-
116
-
117
-
118
-
119
-
120
-
121
-
122
-
123
-
124
-
125
-
126
-
127
-
128
-
129
-
130
-
131
-
132
-
133
-
134
-
135
-
136
-
137
-
138
-
139
-
140
-
141
-
142
-
143
-
144
-
145
-
146
-
147
-
148
-
149
-
150
-
151
-
152
-
153
-
154
-
155
-
156
-
157
-
158
-
159
-
160
-
161
-
162
-
163
-
164
-
165
-
166
-
167
-
168
-
169
-
170
-
171
-
172
-
173
-
174
-
175
-
176
-
177
-
178
-
179
-
180
-
181
-
182
-
183
-
184
-
185
-
186
-
187
-
188
-
189
-
190
-
191
-
192
-
193
-
194
-
195
-
196
-
197
-
198
 |
 |
THE VOLVO GROUP 2013
A year of product renewal
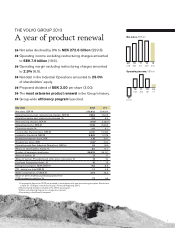
Net sales declined by 9% to SEK 272.6 billion (299.8).
Operating income excluding restructuring charges amounted
to SEK 7.9 billion (19.6).
Operating margin excluding restructuring charges amounted
to 2.9% (6.5).
Net debt in the Industrial Operations amounted to 29.0%
of shareholders’ equity.
Proposed dividend of SEK 3.00 per share (3.00).
The most extensive product renewal in the Group’s history.
Group-wide effi ciency program launched.
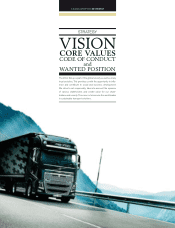
Net sales, SEK bn
1312111009
273300310265218
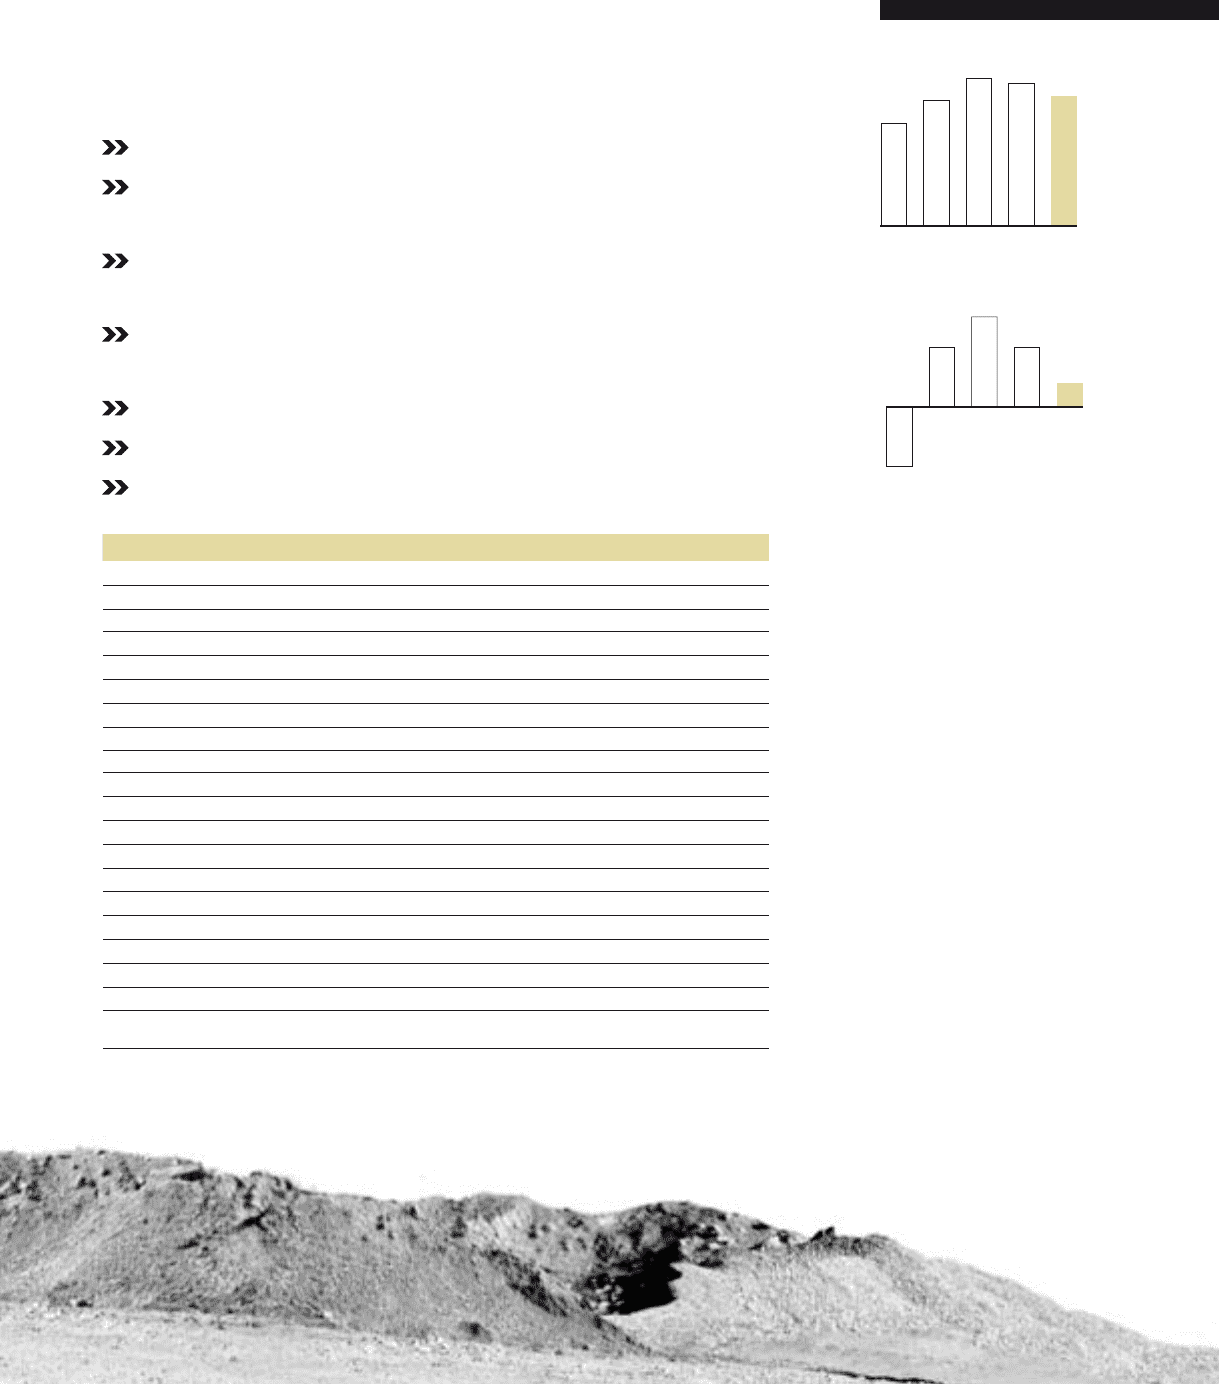
Operating income, SEK bn
1110
09
(17.0)
26.918.015.9
13
7.1
12
18.1
Key ratios 2013 20121
Net sales, SEK M 272,622 299,814
Operating income excl. restructuring charges, SEK M 7,85 4 19,619
Operating margin excl. restructuring charges, % 2.9 6.5
Restructuring charges,SEK M (715)2(1,550)2,3
Operating income, SEK M 7,138 18,069
Operating margin, % 2.6 6.0
Income after fi nancial items, SEK M 4,721 15,495
Income for the period, SEK M 3,802 11, 378
Diluted earnings per share, SEK 1.76 5.61
Dividend per share, SEK 3.0043.00
Operating cash fl ow, Industrial Operations, SEK bn 1.5 (4.9)
Return on shareholders’ equity, % 5.0 14.7
Number of permanent employees 95,533 96,137
Share of women, % 17 17
Share of women,Presidents and other senior executives, % 19 20
Employee Engagement Index, % 76 76
Energy consumption, MWh/SEK M 9.6 8.6
CO2 emissions, tons/SEK M 1.1 0.8
Water consumption, m3/SEK M 21.9 25.2
Share of direct material purchasing spend from
CSR assessed suppliers, % 72 66
1 Comparative fi gures for 2012 are restated in accordance with new accounting principles. Read more
in Note 31, Changes in the Volvo Group’s Financial Reporting 2013.
2 Restructuring charges included in the effi ciency program.
3 Other restructuring charges for comparison reasons.
4 According to the Board’s proposal.
1