Travelers 2011 Annual Report Download - page 99
Download and view the complete annual report
Please find page 99 of the 2011 Travelers annual report below. You can navigate through the pages in the report by either clicking on the pages listed below, or by using the keyword search tool below to find specific information within the annual report.-
 1
1 -
2
-
3
-
4
-
5
-
6
-
7
-
8
-
9
-
10
-
11
-
12
-
13
-
14
-
15
-
16
-
17
-
18
-
19
-
20
-
21
-
22
-
23
-
24
-
25
-
26
-
27
-
28
-
29
-
30
-
31
-
32
-
33
-
34
-
35
-
36
-
37
-
38
-
39
-
40
-
41
-
42
-
43
-
44
-
45
-
46
-
47
-
48
-
49
-
50
-
51
-
52
-
53
-
54
-
55
-
56
-
57
-
58
-
59
-
60
-
61
-
62
-
63
-
64
-
65
-
66
-
67
-
68
-
69
-
70
-
71
-
72
-
73
-
74
-
75
-
76
-
77
-
78
-
79
-
80
-
81
-
82
-
83
-
84
-
85
-
86
-
87
-
88
-
 89
89 -
 90
90 -
 91
91 -
 92
92 -
 93
93 -
 94
94 -
 95
95 -
 96
96 -
 97
97 -
 98
98 -
 99
99 -
 100
100 -
 101
101 -
 102
102 -
 103
103 -
 104
104 -
 105
105 -
 106
106 -
 107
107 -
 108
108 -
 109
109 -
110
-
111
-
112
-
113
-
114
-
115
-
116
-
117
-
118
-
119
-
120
-
121
-
122
-
123
-
124
-
125
-
126
-
127
-
128
-
129
-
130
-
131
-
132
-
133
-
134
-
135
-
136
-
137
-
138
-
139
-
140
-
141
-
142
-
143
-
144
-
145
-
146
-
147
-
148
-
149
-
150
-
151
-
152
-
153
-
154
-
155
-
156
-
157
-
158
-
159
-
160
-
161
-
162
-
163
-
164
-
165
-
166
-
167
-
168
-
169
-
170
-
171
-
172
-
173
-
174
-
175
-
176
-
177
-
178
-
179
-
180
-
181
-
182
-
183
-
184
-
185
-
186
-
187
-
188
-
189
-
190
-
191
-
192
-
193
-
194
-
195
-
196
-
197
-
198
-
199
-
200
-
201
-
202
-
203
-
204
-
205
-
206
-
207
-
208
-
209
-
210
-
211
-
212
-
213
-
214
-
215
-
216
-
217
-
218
-
219
-
220
-
221
-
222
-
223
-
224
-
225
-
226
-
227
-
228
-
229
-
230
-
231
-
232
-
233
-
234
-
235
-
236
-
237
-
238
-
239
-
240
-
241
-
242
-
243
-
244
-
245
-
246
-
247
-
248
-
249
-
250
-
251
-
252
-
253
-
254
-
255
-
256
-
257
-
258
-
259
-
260
-
261
-
262
-
263
-
264
-
265
-
266
-
267
-
268
-
269
-
270
-
271
-
272
-
273
-
274
-
275
-
276
-
277
-
278
-
279
-
280
-
281
-
282
-
283
-
284
-
285
-
286
-
287
-
288
-
289
-
290
-
291
-
292
-
293
 |
 |

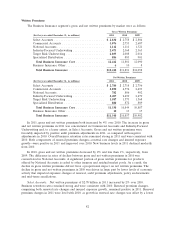
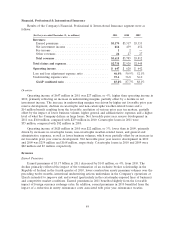
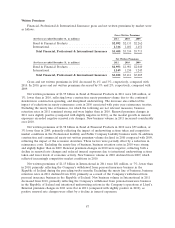
Written Premiums
Financial, Professional & International Insurance gross and net written premiums by market were
as follows:
Gross Written Premiums
(for the year ended December 31, in millions) 2011 2010 2009
Bond & Financial Products ........................ $2,092 $2,133 $2,262
International .................................. 1,316 1,401 1,451
Total Financial, Professional & International Insurance .$3,408 $3,534 $3,713
Net Written Premiums
(for the year ended December 31, in millions) 2011 2010 2009
Bond & Financial Products ........................ $1,953 $1,981 $2,040
International .................................. 1,149 1,230 1,245
Total Financial, Professional & International Insurance .$3,102 $3,211 $3,285
Gross and net written premiums in 2011 decreased by 4% and 3%, respectively, compared with
2010. In 2010, gross and net written premiums decreased by 5% and 2%, respectively, compared with
2009.
Net written premiums of $1.95 billion in Bond & Financial Products in 2011 were $28 million, or
1%, lower than in 2010, reflecting lower construction surety premium volume due to the continued
slowdown in construction spending, and disciplined underwriting. The decrease also reflected the
impact of reductions in surety reinsurance costs in 2010 associated with prior year reinsurance treaties.
Excluding the surety line of business, for which the following are not relevant measures, business
retention rates in 2011 remained strong and were higher than in 2010. Renewal premium changes in
2011 were slightly positive (compared with slightly negative in 2010), as the modest growth in insured
exposures exceeded negative renewal rate changes. New business volume in 2011 increased considerably
over 2010.
Net written premiums of $1.98 billion in Bond & Financial Products in 2010 were $59 million, or
3% lower than in 2009, primarily reflecting the impact of underwriting actions taken and competitive
market conditions in the Professional Liability and Public Company Liability business units. In addition,
construction and commercial surety net written premium volume declined in 2010 compared with 2009,
reflecting the impact of the economic downturn. These factors were partially offset by a reduction in
reinsurance costs. Excluding the surety line of business, business retention rates in 2010 were strong
and slightly higher than in 2009. Renewal premium changes in 2010 were negative, reflecting both a
decline in renewal rate changes and reduced insured exposures due to intentional underwriting actions
taken and lower levels of economic activity. New business volume in 2010 declined from 2009, which
reflected increasingly competitive market conditions in 2010.
Net written premiums of $1.15 billion in International in 2011 were $81 million, or 7%, lower than
in 2010, primarily reflecting the Company’s withdrawal from personal insurance business in the
Republic of Ireland during the preceding twelve months. Excluding the surety line of business, business
retention rates in 2011 declined from 2010, primarily as a result of the Company’s withdrawal from
personal insurance business in the Republic of Ireland. New business volume in International in 2011
decreased from 2010, primarily reflecting the Company’s withdrawal from personal insurance business
in the Republic of Ireland and intentional underwriting actions in the Company’s operations at Lloyd’s.
Renewal premium changes in 2011 were flat in 2011 (compared with slightly positive in 2010), as
positive renewal rate changes were offset by a decline in insured exposures.
87