Travelers 2011 Annual Report Download - page 245
Download and view the complete annual report
Please find page 245 of the 2011 Travelers annual report below. You can navigate through the pages in the report by either clicking on the pages listed below, or by using the keyword search tool below to find specific information within the annual report.-
 1
1 -
2
-
3
-
4
-
5
-
6
-
7
-
8
-
9
-
10
-
11
-
12
-
13
-
14
-
15
-
16
-
17
-
18
-
19
-
20
-
21
-
22
-
23
-
24
-
25
-
26
-
27
-
28
-
29
-
30
-
31
-
32
-
33
-
34
-
35
-
36
-
37
-
38
-
39
-
40
-
41
-
42
-
43
-
44
-
45
-
46
-
47
-
48
-
49
-
50
-
51
-
52
-
53
-
54
-
55
-
56
-
57
-
58
-
59
-
60
-
61
-
62
-
63
-
64
-
65
-
66
-
67
-
68
-
69
-
70
-
71
-
72
-
73
-
74
-
75
-
76
-
77
-
78
-
79
-
80
-
81
-
82
-
83
-
84
-
85
-
86
-
87
-
88
-
89
-
90
-
91
-
92
-
93
-
94
-
95
-
96
-
97
-
98
-
99
-
100
-
101
-
102
-
103
-
104
-
105
-
106
-
107
-
108
-
109
-
110
-
111
-
112
-
113
-
114
-
115
-
116
-
117
-
118
-
119
-
120
-
121
-
122
-
123
-
124
-
125
-
126
-
127
-
128
-
129
-
130
-
131
-
132
-
133
-
134
-
135
-
136
-
137
-
138
-
139
-
140
-
141
-
142
-
143
-
144
-
145
-
146
-
147
-
148
-
149
-
150
-
151
-
152
-
153
-
154
-
155
-
156
-
157
-
158
-
159
-
160
-
161
-
162
-
163
-
164
-
165
-
166
-
167
-
168
-
169
-
170
-
171
-
172
-
173
-
174
-
175
-
176
-
177
-
178
-
179
-
180
-
181
-
182
-
183
-
184
-
185
-
186
-
187
-
188
-
189
-
190
-
191
-
192
-
193
-
194
-
195
-
196
-
197
-
198
-
199
-
200
-
201
-
202
-
203
-
204
-
205
-
206
-
207
-
208
-
209
-
210
-
211
-
212
-
213
-
214
-
215
-
216
-
217
-
218
-
219
-
220
-
221
-
222
-
223
-
224
-
225
-
226
-
227
-
228
-
229
-
230
-
231
-
232
-
233
-
234
-
 235
235 -
 236
236 -
 237
237 -
 238
238 -
 239
239 -
 240
240 -
 241
241 -
 242
242 -
 243
243 -
 244
244 -
 245
245 -
 246
246 -
 247
247 -
 248
248 -
 249
249 -
 250
250 -
 251
251 -
 252
252 -
 253
253 -
 254
254 -
 255
255 -
256
-
257
-
258
-
259
-
260
-
261
-
262
-
263
-
264
-
265
-
266
-
267
-
268
-
269
-
270
-
271
-
272
-
273
-
274
-
275
-
276
-
277
-
278
-
279
-
280
-
281
-
282
-
283
-
284
-
285
-
286
-
287
-
288
-
289
-
290
-
291
-
292
-
293
 |
 |

THE TRAVELERS COMPANIES, INC. AND SUBSIDIARIES
NOTES TO CONSOLIDATED FINANCIAL STATEMENTS (Continued)
13. PENSION PLANS, RETIREMENT BENEFITS AND SAVINGS PLANS (Continued)
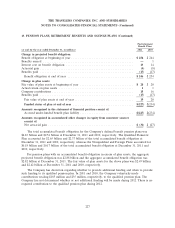
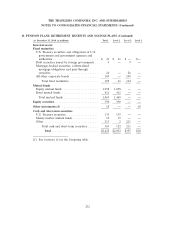
The following table presents the changes in the Level 3 fair value category for the years ended
December 31, 2011 and 2010.
Other
Investments
(at and for the year ended December 31, in millions) 2011 2010
Balance at beginning of year ................................ $18 $17
Actual return on plan assets:
Relating to assets still held ................................ (1) 3
Relating to assets sold during the year ........................ ——
Purchases, sales, settlements and maturities:
Purchases ............................................ 2—
Sales ................................................ (1) (2)
Settlements/maturities ................................... ——
Gross transfers into Level 3 ................................. ——
Gross transfers out of Level 3 ............................... ——
Balance at end of year ................................. $18 $18
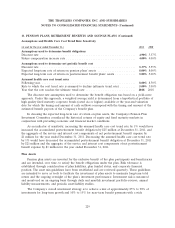
Other Postretirement Benefit Plan
The Company’s overall investment strategy is to achieve a mix of approximately 35% to 65% of
investments for long-term growth and 35% to 60% for near-term insurance payments with a wide
diversification of asset types, fund strategies and fund managers. The current target allocations for plan
assets are 25% to 75% fixed income securities, with the remainder allocated to short-term securities.
Fixed income securities include corporate bonds of companies from diversified industries, mortgage-
backed securities and U.S. Treasuries.
Fair Value—Other Postretirement Benefit Plan
The Company’s other postretirement benefit plan had financial assets of $19 million and
$20 million at December 31, 2011 and 2010, respectively, which are measured at fair value on a
recurring basis. The assets are primarily short-term securities and corporate bonds, and categorized as
level 2 in the fair value hierarchy.
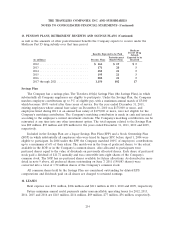
Estimated Future Benefit Payments
The following table presents the estimated benefits expected to be paid by the Company’s pension
and postretirement benefit plans for the next ten years (reflecting estimated future employee service),
233