Travelers 2011 Annual Report Download - page 82
Download and view the complete annual report
Please find page 82 of the 2011 Travelers annual report below. You can navigate through the pages in the report by either clicking on the pages listed below, or by using the keyword search tool below to find specific information within the annual report.-
 1
1 -
2
-
3
-
4
-
5
-
6
-
7
-
8
-
9
-
10
-
11
-
12
-
13
-
14
-
15
-
16
-
17
-
18
-
19
-
20
-
21
-
22
-
23
-
24
-
25
-
26
-
27
-
28
-
29
-
30
-
31
-
32
-
33
-
34
-
35
-
36
-
37
-
38
-
39
-
40
-
41
-
42
-
43
-
44
-
45
-
46
-
47
-
48
-
49
-
50
-
51
-
52
-
53
-
54
-
55
-
56
-
57
-
58
-
59
-
60
-
61
-
62
-
63
-
64
-
65
-
66
-
67
-
68
-
69
-
70
-
71
-
 72
72 -
 73
73 -
 74
74 -
 75
75 -
 76
76 -
 77
77 -
 78
78 -
 79
79 -
 80
80 -
 81
81 -
 82
82 -
 83
83 -
 84
84 -
 85
85 -
 86
86 -
 87
87 -
 88
88 -
 89
89 -
 90
90 -
 91
91 -
 92
92 -
93
-
94
-
95
-
96
-
97
-
98
-
99
-
100
-
101
-
102
-
103
-
104
-
105
-
106
-
107
-
108
-
109
-
110
-
111
-
112
-
113
-
114
-
115
-
116
-
117
-
118
-
119
-
120
-
121
-
122
-
123
-
124
-
125
-
126
-
127
-
128
-
129
-
130
-
131
-
132
-
133
-
134
-
135
-
136
-
137
-
138
-
139
-
140
-
141
-
142
-
143
-
144
-
145
-
146
-
147
-
148
-
149
-
150
-
151
-
152
-
153
-
154
-
155
-
156
-
157
-
158
-
159
-
160
-
161
-
162
-
163
-
164
-
165
-
166
-
167
-
168
-
169
-
170
-
171
-
172
-
173
-
174
-
175
-
176
-
177
-
178
-
179
-
180
-
181
-
182
-
183
-
184
-
185
-
186
-
187
-
188
-
189
-
190
-
191
-
192
-
193
-
194
-
195
-
196
-
197
-
198
-
199
-
200
-
201
-
202
-
203
-
204
-
205
-
206
-
207
-
208
-
209
-
210
-
211
-
212
-
213
-
214
-
215
-
216
-
217
-
218
-
219
-
220
-
221
-
222
-
223
-
224
-
225
-
226
-
227
-
228
-
229
-
230
-
231
-
232
-
233
-
234
-
235
-
236
-
237
-
238
-
239
-
240
-
241
-
242
-
243
-
244
-
245
-
246
-
247
-
248
-
249
-
250
-
251
-
252
-
253
-
254
-
255
-
256
-
257
-
258
-
259
-
260
-
261
-
262
-
263
-
264
-
265
-
266
-
267
-
268
-
269
-
270
-
271
-
272
-
273
-
274
-
275
-
276
-
277
-
278
-
279
-
280
-
281
-
282
-
283
-
284
-
285
-
286
-
287
-
288
-
289
-
290
-
291
-
292
-
293
 |
 |

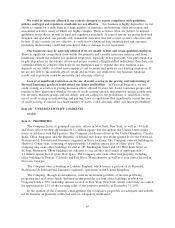
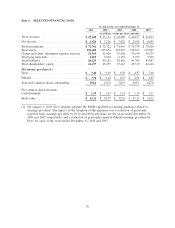
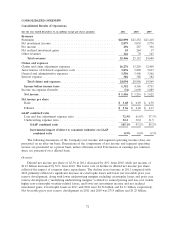
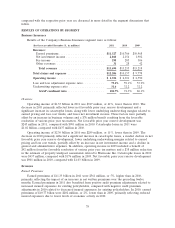
Item 6. SELECTED FINANCIAL DATA
At and for the year ended December 31,
2011 2010 2009 2008 2007
(in millions, except per share amounts)
Total revenues ........................ $ 25,446 $ 25,112 $ 24,680 $ 24,477 $ 26,017
Net income .......................... $ 1,426 $ 3,216 $ 3,622 $ 2,924 $ 4,601
Total investments ...................... $ 72,701 $ 72,722 $ 74,965 $ 70,738 $ 74,818
Total assets .......................... 104,602 105,656 110,035 110,107 115,699
Claims and claim adjustment expense reserves . 51,419 51,606 53,602 55,198 58,175
Total long-term debt .................... 6,255 6,502 6,154 5,939 5,590
Total liabilities ........................ 80,125 80,181 82,620 84,788 89,083
Total shareholders’ equity ................ 24,477 25,475 27,415 25,319 26,616
Net income per share(1):
Basic ............................... $ 3.40 $ 6.69 $ 6.38 $ 4.87 $ 7.00
Diluted ............................. $ 3.36 $ 6.62 $ 6.33 $ 4.81 $ 6.85
Year-end common shares outstanding ....... 392.8 434.6 520.3 585.1 627.8
Per common share amounts:
Cash dividends ........................ $ 1.59 $ 1.41 $ 1.23 $ 1.19 $ 1.13
Book value .......................... $ 62.32 $ 58.47 $ 52.54 $ 43.12 $ 42.22
(1) On January 1, 2009, the Company adopted the FASB’s updated accounting guidance related to
earnings per share. The impact of the adoption of this guidance was a reduction of previously
reported basic earnings per share by $0.03 and $0.04 per share for the years ended December 31,
2008 and 2007, respectively, and a reduction of previously reported diluted earnings per share by
$0.01 for each of the years ended December 31, 2008 and 2007.
70