Travelers 2011 Annual Report Download - page 92
Download and view the complete annual report
Please find page 92 of the 2011 Travelers annual report below. You can navigate through the pages in the report by either clicking on the pages listed below, or by using the keyword search tool below to find specific information within the annual report.-
 1
1 -
2
-
3
-
4
-
5
-
6
-
7
-
8
-
9
-
10
-
11
-
12
-
13
-
14
-
15
-
16
-
17
-
18
-
19
-
20
-
21
-
22
-
23
-
24
-
25
-
26
-
27
-
28
-
29
-
30
-
31
-
32
-
33
-
34
-
35
-
36
-
37
-
38
-
39
-
40
-
41
-
42
-
43
-
44
-
45
-
46
-
47
-
48
-
49
-
50
-
51
-
52
-
53
-
54
-
55
-
56
-
57
-
58
-
59
-
60
-
61
-
62
-
63
-
64
-
65
-
66
-
67
-
68
-
69
-
70
-
71
-
72
-
73
-
74
-
75
-
76
-
77
-
78
-
79
-
80
-
81
-
 82
82 -
 83
83 -
 84
84 -
 85
85 -
 86
86 -
 87
87 -
 88
88 -
 89
89 -
 90
90 -
 91
91 -
 92
92 -
 93
93 -
 94
94 -
 95
95 -
 96
96 -
 97
97 -
 98
98 -
 99
99 -
 100
100 -
 101
101 -
 102
102 -
103
-
104
-
105
-
106
-
107
-
108
-
109
-
110
-
111
-
112
-
113
-
114
-
115
-
116
-
117
-
118
-
119
-
120
-
121
-
122
-
123
-
124
-
125
-
126
-
127
-
128
-
129
-
130
-
131
-
132
-
133
-
134
-
135
-
136
-
137
-
138
-
139
-
140
-
141
-
142
-
143
-
144
-
145
-
146
-
147
-
148
-
149
-
150
-
151
-
152
-
153
-
154
-
155
-
156
-
157
-
158
-
159
-
160
-
161
-
162
-
163
-
164
-
165
-
166
-
167
-
168
-
169
-
170
-
171
-
172
-
173
-
174
-
175
-
176
-
177
-
178
-
179
-
180
-
181
-
182
-
183
-
184
-
185
-
186
-
187
-
188
-
189
-
190
-
191
-
192
-
193
-
194
-
195
-
196
-
197
-
198
-
199
-
200
-
201
-
202
-
203
-
204
-
205
-
206
-
207
-
208
-
209
-
210
-
211
-
212
-
213
-
214
-
215
-
216
-
217
-
218
-
219
-
220
-
221
-
222
-
223
-
224
-
225
-
226
-
227
-
228
-
229
-
230
-
231
-
232
-
233
-
234
-
235
-
236
-
237
-
238
-
239
-
240
-
241
-
242
-
243
-
244
-
245
-
246
-
247
-
248
-
249
-
250
-
251
-
252
-
253
-
254
-
255
-
256
-
257
-
258
-
259
-
260
-
261
-
262
-
263
-
264
-
265
-
266
-
267
-
268
-
269
-
270
-
271
-
272
-
273
-
274
-
275
-
276
-
277
-
278
-
279
-
280
-
281
-
282
-
283
-
284
-
285
-
286
-
287
-
288
-
289
-
290
-
291
-
292
-
293
 |
 |
decline in net favorable prior year reserve development and the impact of loss cost trends. Catastrophe
losses in 2010 and 2009 were $437 million and $176 million, respectively. Catastrophe losses in 2010
primarily resulted from several severe wind and hail storms as well as severe winter storms. Net
favorable prior year reserve development in 2010 and 2009 was $901 million and $1.03 billion,
respectively. Net favorable prior year reserve development in 2010 was driven by better than expected
loss development in the property, general liability (excluding increases to asbestos and environmental
reserves discussed below) and workers’ compensation product lines for multiple accident years, as well
as in assumed reinsurance, which is in runoff. The property product line improvement primarily
occurred in the 2008 and 2009 accident years as a result of better than expected loss development in
Industry-Focused Underwriting and Target Risk Underwriting. The general liability product line
improvement was concentrated in excess coverages for accident years 2006 and prior and reflected what
the Company believes are more favorable legal and judicial environments than what the Company
previously expected. Net favorable prior year reserve development in the workers’ compensation
product line was concentrated in accident years 2007 and prior and resulted from better than expected
loss development. The improvement in assumed reinsurance resulted primarily from favorable
resolutions of claims and disputes from accident years 2002 and prior. In addition, better than expected
loss development in the Business Insurance segment in recent years resulted in a favorable
re-estimation of reserves for unallocated loss adjustment expenses in 2010. The net favorable prior year
reserve development in these product lines in 2010 was partially offset by $140 million and $35 million
increases to asbestos and environmental reserves, respectively (discussed in further detail in the
‘‘Asbestos Claims and Litigation’’ and ‘‘Environmental Claims and Litigation’’ sections herein).
Net favorable prior year reserve development in 2009 of $1.03 billion was driven by better than
expected loss development primarily concentrated in the general liability (excluding increases to
asbestos and environmental reserves discussed below), commercial multi-peril, commercial automobile
and commercial property product lines for recent accident years, reflecting greater reductions in
frequency than the Company expected based upon long-term frequency trends that have been declining.
The general liability and commercial multi-peril product lines experienced better than anticipated loss
development that was attributable to several factors, including what the Company believes to be
improved legal and judicial environments, as well as enhanced risk control, underwriting and claim
process initiatives. The commercial automobile line of business experienced better than expected loss
development that was attributable to what the Company believes to be more favorable legal and
judicial environments than what the Company previously expected, claim handling initiatives and
improvements in auto safety technology. The commercial property product line improvement primarily
occurred in the 2007 and 2008 accident years as a result of better than expected loss development for
certain large national property and inland marine exposures. In addition, the commercial property
product line’s 2005 accident year experience improved due to the litigation environment relating to, and
ongoing claim settlements for, Hurricane Katrina. The net favorable prior year reserve development in
these product lines in 2009 was partially offset by $185 million and $70 million increases to asbestos
reserves and environmental reserves, respectively (discussed in more detail in the ‘‘Asbestos Claims and
Litigation’’ and ‘‘Environmental Claims and Litigation’’ sections herein).
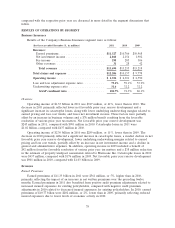
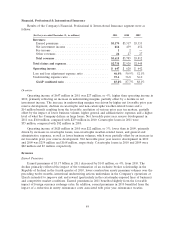
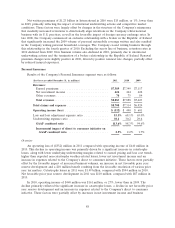
Amortization of Deferred Acquisition Expenses
The amortization of deferred acquisition costs in 2011 was $1.82 billion, $66 million, or 4%, higher
than in 2010. The amortization of deferred acquisition costs in 2010 was $1.75 billion, $26 million, or
1%, lower than in 2009. The changes in both 2011 and 2010 were consistent with the changes in earned
premiums compared to the respective prior year.
80