Travelers 2011 Annual Report Download - page 236
Download and view the complete annual report
Please find page 236 of the 2011 Travelers annual report below. You can navigate through the pages in the report by either clicking on the pages listed below, or by using the keyword search tool below to find specific information within the annual report.-
 1
1 -
 2
2 -
 3
3 -
 4
4 -
 5
5 -
 6
6 -
 7
7 -
 8
8 -
 9
9 -
 10
10 -
 11
11 -
 12
12 -
 13
13 -
 14
14 -
 15
15 -
 16
16 -
 17
17 -
 18
18 -
 19
19 -
 20
20 -
 21
21 -
 22
22 -
 23
23 -
 24
24 -
 25
25 -
 26
26 -
 27
27 -
 28
28 -
 29
29 -
 30
30 -
 31
31 -
 32
32 -
 33
33 -
 34
34 -
 35
35 -
 36
36 -
 37
37 -
 38
38 -
 39
39 -
 40
40 -
 41
41 -
 42
42 -
 43
43 -
 44
44 -
 45
45 -
 46
46 -
 47
47 -
 48
48 -
 49
49 -
 50
50 -
 51
51 -
 52
52 -
 53
53 -
 54
54 -
 55
55 -
 56
56 -
 57
57 -
 58
58 -
 59
59 -
 60
60 -
 61
61 -
 62
62 -
 63
63 -
 64
64 -
 65
65 -
 66
66 -
 67
67 -
 68
68 -
 69
69 -
 70
70 -
 71
71 -
 72
72 -
 73
73 -
 74
74 -
 75
75 -
 76
76 -
 77
77 -
 78
78 -
 79
79 -
 80
80 -
 81
81 -
 82
82 -
 83
83 -
 84
84 -
 85
85 -
 86
86 -
 87
87 -
 88
88 -
 89
89 -
 90
90 -
 91
91 -
 92
92 -
 93
93 -
 94
94 -
 95
95 -
 96
96 -
 97
97 -
 98
98 -
 99
99 -
 100
100 -
 101
101 -
 102
102 -
 103
103 -
 104
104 -
 105
105 -
 106
106 -
 107
107 -
 108
108 -
 109
109 -
 110
110 -
 111
111 -
 112
112 -
 113
113 -
 114
114 -
 115
115 -
 116
116 -
 117
117 -
 118
118 -
 119
119 -
 120
120 -
 121
121 -
 122
122 -
 123
123 -
 124
124 -
 125
125 -
 126
126 -
 127
127 -
 128
128 -
 129
129 -
 130
130 -
 131
131 -
 132
132 -
 133
133 -
 134
134 -
 135
135 -
 136
136 -
 137
137 -
 138
138 -
 139
139 -
 140
140 -
 141
141 -
 142
142 -
 143
143 -
 144
144 -
 145
145 -
 146
146 -
 147
147 -
 148
148 -
 149
149 -
 150
150 -
 151
151 -
 152
152 -
 153
153 -
 154
154 -
 155
155 -
 156
156 -
 157
157 -
 158
158 -
 159
159 -
 160
160 -
 161
161 -
 162
162 -
 163
163 -
 164
164 -
 165
165 -
 166
166 -
 167
167 -
 168
168 -
 169
169 -
 170
170 -
 171
171 -
 172
172 -
 173
173 -
 174
174 -
 175
175 -
 176
176 -
 177
177 -
 178
178 -
 179
179 -
 180
180 -
 181
181 -
 182
182 -
 183
183 -
 184
184 -
 185
185 -
 186
186 -
 187
187 -
 188
188 -
 189
189 -
 190
190 -
 191
191 -
 192
192 -
 193
193 -
 194
194 -
 195
195 -
 196
196 -
 197
197 -
 198
198 -
 199
199 -
 200
200 -
 201
201 -
 202
202 -
 203
203 -
 204
204 -
 205
205 -
 206
206 -
 207
207 -
 208
208 -
 209
209 -
 210
210 -
 211
211 -
 212
212 -
 213
213 -
 214
214 -
 215
215 -
 216
216 -
 217
217 -
 218
218 -
 219
219 -
 220
220 -
 221
221 -
 222
222 -
 223
223 -
 224
224 -
 225
225 -
 226
226 -
 227
227 -
 228
228 -
 229
229 -
 230
230 -
 231
231 -
 232
232 -
 233
233 -
 234
234 -
 235
235 -
 236
236 -
 237
237 -
 238
238 -
 239
239 -
 240
240 -
 241
241 -
 242
242 -
 243
243 -
 244
244 -
 245
245 -
 246
246 -
 247
247 -
 248
248 -
 249
249 -
 250
250 -
 251
251 -
 252
252 -
 253
253 -
 254
254 -
 255
255 -
 256
256 -
 257
257 -
 258
258 -
 259
259 -
 260
260 -
 261
261 -
 262
262 -
 263
263 -
 264
264 -
 265
265 -
 266
266 -
 267
267 -
 268
268 -
 269
269 -
 270
270 -
 271
271 -
 272
272 -
 273
273 -
 274
274 -
 275
275 -
 276
276 -
 277
277 -
 278
278 -
 279
279 -
 280
280 -
 281
281 -
 282
282 -
 283
283 -
 284
284 -
 285
285 -
 286
286 -
 287
287 -
 288
288 -
 289
289 -
 290
290 -
 291
291 -
 292
292 -
 293
293
 |
 |

THE TRAVELERS COMPANIES, INC. AND SUBSIDIARIES
NOTES TO CONSOLIDATED FINANCIAL STATEMENTS (Continued)
12. SHARE-BASED INCENTIVE COMPENSATION (Continued)
years from the date of grant, do not have voting rights and the underlying shares of common stock are
not issued until the vesting criteria is satisfied.
The Company also has a Performance Share Awards Program pursuant to the 2004 Incentive Plan
which became effective beginning in 2006. Under the program, the Company may issue performance
share awards to certain employees of the Company who hold positions of Vice President (or its
equivalent) or above. The performance awards provide the recipient the right to earn shares of the
Company’s common stock based upon the Company’s attainment of certain performance goals. The
performance goals for performance awards are based on the Company’s adjusted return on equity over
a three-year performance period. Vesting of any performance shares is contingent upon the Company
attaining the relevant performance period minimum threshold return on equity. If the performance
period return on equity is below the minimum threshold, none of the shares will vest. If performance
meets or exceeds the minimum performance threshold, a range of performance shares will vest (50%—
160% for awards granted prior to and including February 2009; 50%—150% for awards granted in
February 2010; 50%—130% for awards granted in February 2011 and 50%—130% for awards granted
in February 2012), depending on the actual return on equity attained.
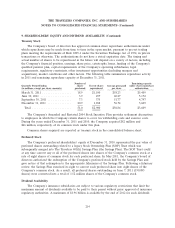
The fair value of restricted stock units, deferred stock and performance shares is measured at the
market price of the Company stock at date of grant.
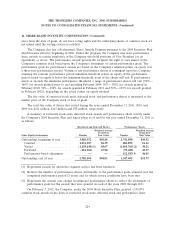
The total fair value of shares that vested during the years ended December 31, 2011, 2010 and
2009 was $121 million, $113 million and $78 million, respectively.
A summary of restricted stock units, deferred stock awards and performance share activity under
the Company’s 2004 Incentive Plan and legacy plans as of and for the year ended December 31, 2011 is
as follows:
Restricted and Deferred Shares Performance Shares
Weighted Average Weighted Average
Grant-Date Grant-Date
Other Equity Instruments Number Fair Value Number Fair Value
Outstanding, beginning of year ...... 3,086,352 $45.46 1,743,890 $44.52
Granted ..................... 1,034,387 56.39 801,095 56.11
Vested ...................... (1,158,649)(1) 48.67 (1,010,765)(2) 40.21
Forfeited .................... (181,586) 47.90 (99,405) 49.57
Performance-based adjustment .... — — 112,587(3) 46.01
Outstanding, end of year .......... 2,780,504 $48.03 1,547,402 $53.79
(1) Represents awards for which the requisite service has been rendered.
(2) Reflects the number of performance shares attributable to the performance goals attained over the
completed performance period (3 years) and for which service conditions have been met.
(3) Represents the current year change in estimated performance shares to reflect the attainment of
performance goals for the awards that were granted in each of the years 2008 through 2011.
On February 7, 2012, the Company, under the 2004 Stock Incentive Plan, granted 1,556,874
common stock awards in the form of restricted stock units, deferred stock and performance share
224
