Travelers 2011 Annual Report Download - page 102
Download and view the complete annual report
Please find page 102 of the 2011 Travelers annual report below. You can navigate through the pages in the report by either clicking on the pages listed below, or by using the keyword search tool below to find specific information within the annual report.-
 1
1 -
2
-
3
-
4
-
5
-
6
-
7
-
8
-
9
-
10
-
11
-
12
-
13
-
14
-
15
-
16
-
17
-
18
-
19
-
20
-
21
-
22
-
23
-
24
-
25
-
26
-
27
-
28
-
29
-
30
-
31
-
32
-
33
-
34
-
35
-
36
-
37
-
38
-
39
-
40
-
41
-
42
-
43
-
44
-
45
-
46
-
47
-
48
-
49
-
50
-
51
-
52
-
53
-
54
-
55
-
56
-
57
-
58
-
59
-
60
-
61
-
62
-
63
-
64
-
65
-
66
-
67
-
68
-
69
-
70
-
71
-
72
-
73
-
74
-
75
-
76
-
77
-
78
-
79
-
80
-
81
-
82
-
83
-
84
-
85
-
86
-
87
-
88
-
89
-
90
-
91
-
 92
92 -
 93
93 -
 94
94 -
 95
95 -
 96
96 -
 97
97 -
 98
98 -
 99
99 -
 100
100 -
 101
101 -
 102
102 -
 103
103 -
 104
104 -
 105
105 -
 106
106 -
 107
107 -
 108
108 -
 109
109 -
 110
110 -
 111
111 -
 112
112 -
113
-
114
-
115
-
116
-
117
-
118
-
119
-
120
-
121
-
122
-
123
-
124
-
125
-
126
-
127
-
128
-
129
-
130
-
131
-
132
-
133
-
134
-
135
-
136
-
137
-
138
-
139
-
140
-
141
-
142
-
143
-
144
-
145
-
146
-
147
-
148
-
149
-
150
-
151
-
152
-
153
-
154
-
155
-
156
-
157
-
158
-
159
-
160
-
161
-
162
-
163
-
164
-
165
-
166
-
167
-
168
-
169
-
170
-
171
-
172
-
173
-
174
-
175
-
176
-
177
-
178
-
179
-
180
-
181
-
182
-
183
-
184
-
185
-
186
-
187
-
188
-
189
-
190
-
191
-
192
-
193
-
194
-
195
-
196
-
197
-
198
-
199
-
200
-
201
-
202
-
203
-
204
-
205
-
206
-
207
-
208
-
209
-
210
-
211
-
212
-
213
-
214
-
215
-
216
-
217
-
218
-
219
-
220
-
221
-
222
-
223
-
224
-
225
-
226
-
227
-
228
-
229
-
230
-
231
-
232
-
233
-
234
-
235
-
236
-
237
-
238
-
239
-
240
-
241
-
242
-
243
-
244
-
245
-
246
-
247
-
248
-
249
-
250
-
251
-
252
-
253
-
254
-
255
-
256
-
257
-
258
-
259
-
260
-
261
-
262
-
263
-
264
-
265
-
266
-
267
-
268
-
269
-
270
-
271
-
272
-
273
-
274
-
275
-
276
-
277
-
278
-
279
-
280
-
281
-
282
-
283
-
284
-
285
-
286
-
287
-
288
-
289
-
290
-
291
-
292
-
293
 |
 |
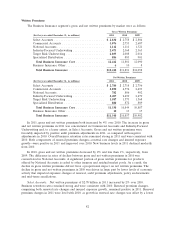
2009. Net favorable prior year reserve development in 2009 primarily reflected favorable loss
development related to Hurricanes Ike and Katrina, as well as the 2007 California wildfires.
Amortization of Deferred Acquisition Costs
The amortization of deferred acquisition costs was $1.46 million in 2011, $17 million, or 1%,
higher than in 2010. The increase in 2011 was less than the increase in earned premiums, primarily
reflecting an increase in the number of agents reverting to a contingent commission compensation
program (the costs of which are classified in ‘‘general and administrative expenses’’) from a fixed-value
compensation program (the costs of which are classified in ‘‘amortization of deferred acquisition
costs’’). The amortization of deferred acquisition costs in 2010 was $1.44 billion, $25 million, or 2%,
higher than in 2009. The increase in 2010 was consistent with the increase in earned premiums.
General and Administrative Expenses
General and administrative expenses of $908 million in 2011 were $41 million, or 5%, higher than
in 2010. The increase in 2011 was primarily driven by costs associated with the Company’s direct to
consumer initiative, as well as the increase in contingent commission expense due to the increase in the
number of agents reverting to a contingent commission compensation program. The cost of the
contingent commission program is not subject to deferred acquisition cost accounting treatment and,
therefore, is expensed as incurred.
General and administrative expenses of $867 million in 2010 were $83 million, or 11%, higher than
in 2009. The total in 2009 reflected a $48 million reduction in the estimate of property windpool
assessments related to Hurricane Ike, which occurred in 2008. Adjusting for the impact of the reduction
in windpool assessments in 2009, general and administrative expenses in 2010 increased $35 million, or
4%, over 2009, primarily reflecting growth in business volume and continued costs supporting business
growth and product development, including the Company’s direct to consumer initiative.
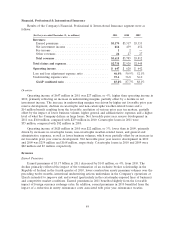
GAAP Combined Ratio
The GAAP combined ratio of 113.6% in 2011 was 15.3 points higher than the GAAP combined
ratio of 98.3% in 2010.
The loss and loss adjustment expense ratio of 83.5% in 2011 was 15.4 points higher than the 2010
ratio of 68.1%. Catastrophe losses accounted for 19.6 and 8.1 points of the loss and loss adjustment
expense ratio in 2011 and 2010, respectively. Net favorable prior year reserve development provided 1.5
points and 1.2 points of benefit to the loss and loss adjustment expense ratio in 2011 and 2010,
respectively. The 2011 loss and loss adjustment expense ratio excluding catastrophe losses and prior
year reserve development was 4.2 points higher than the 2010 ratio on the same basis, primarily
reflecting the impact of higher non-catastrophe weather-related losses.
The underwriting expense ratio of 30.1% in 2011 was 0.1 points lower than the underwriting
expense ratio of 30.2% in 2010. The slight decline in the underwriting expense ratio for 2011 compared
with 2010 reflected growth in earned premiums and increases in costs associated with the Company’s
direct to consumer initiative, the impacts of which were largely offsetting.
The GAAP combined ratio of 98.3% in 2010 was 3.7 points higher than the GAAP combined ratio
of 94.6% in 2009.
The loss and loss adjustment expense ratio of 68.1% in 2010 was 3.1 points higher than the 2009
ratio of 65.0%. Catastrophe losses accounted for 8.1 and 3.9 points of the loss and loss adjustment
expense ratio in 2010 and 2009, respectively. Net favorable prior year reserve development provided 1.2
points and 1.9 points of benefit to the loss and loss adjustment expense ratio in 2010 and 2009,
respectively. The 2010 loss and loss adjustment expense ratio excluding catastrophe losses and prior
90