Travelers 2011 Annual Report Download - page 90
Download and view the complete annual report
Please find page 90 of the 2011 Travelers annual report below. You can navigate through the pages in the report by either clicking on the pages listed below, or by using the keyword search tool below to find specific information within the annual report.-
 1
1 -
2
-
3
-
4
-
5
-
6
-
7
-
8
-
9
-
10
-
11
-
12
-
13
-
14
-
15
-
16
-
17
-
18
-
19
-
20
-
21
-
22
-
23
-
24
-
25
-
26
-
27
-
28
-
29
-
30
-
31
-
32
-
33
-
34
-
35
-
36
-
37
-
38
-
39
-
40
-
41
-
42
-
43
-
44
-
45
-
46
-
47
-
48
-
49
-
50
-
51
-
52
-
53
-
54
-
55
-
56
-
57
-
58
-
59
-
60
-
61
-
62
-
63
-
64
-
65
-
66
-
67
-
68
-
69
-
70
-
71
-
72
-
73
-
74
-
75
-
76
-
77
-
78
-
79
-
 80
80 -
 81
81 -
 82
82 -
 83
83 -
 84
84 -
 85
85 -
 86
86 -
 87
87 -
 88
88 -
 89
89 -
 90
90 -
 91
91 -
 92
92 -
 93
93 -
 94
94 -
 95
95 -
 96
96 -
 97
97 -
 98
98 -
 99
99 -
 100
100 -
101
-
102
-
103
-
104
-
105
-
106
-
107
-
108
-
109
-
110
-
111
-
112
-
113
-
114
-
115
-
116
-
117
-
118
-
119
-
120
-
121
-
122
-
123
-
124
-
125
-
126
-
127
-
128
-
129
-
130
-
131
-
132
-
133
-
134
-
135
-
136
-
137
-
138
-
139
-
140
-
141
-
142
-
143
-
144
-
145
-
146
-
147
-
148
-
149
-
150
-
151
-
152
-
153
-
154
-
155
-
156
-
157
-
158
-
159
-
160
-
161
-
162
-
163
-
164
-
165
-
166
-
167
-
168
-
169
-
170
-
171
-
172
-
173
-
174
-
175
-
176
-
177
-
178
-
179
-
180
-
181
-
182
-
183
-
184
-
185
-
186
-
187
-
188
-
189
-
190
-
191
-
192
-
193
-
194
-
195
-
196
-
197
-
198
-
199
-
200
-
201
-
202
-
203
-
204
-
205
-
206
-
207
-
208
-
209
-
210
-
211
-
212
-
213
-
214
-
215
-
216
-
217
-
218
-
219
-
220
-
221
-
222
-
223
-
224
-
225
-
226
-
227
-
228
-
229
-
230
-
231
-
232
-
233
-
234
-
235
-
236
-
237
-
238
-
239
-
240
-
241
-
242
-
243
-
244
-
245
-
246
-
247
-
248
-
249
-
250
-
251
-
252
-
253
-
254
-
255
-
256
-
257
-
258
-
259
-
260
-
261
-
262
-
263
-
264
-
265
-
266
-
267
-
268
-
269
-
270
-
271
-
272
-
273
-
274
-
275
-
276
-
277
-
278
-
279
-
280
-
281
-
282
-
283
-
284
-
285
-
286
-
287
-
288
-
289
-
290
-
291
-
292
-
293
 |
 |

compared with the respective prior year are discussed in more detail in the segment discussions that
follow.
RESULTS OF OPERATIONS BY SEGMENT
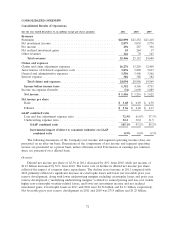
Business Insurance
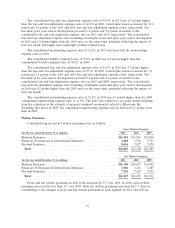
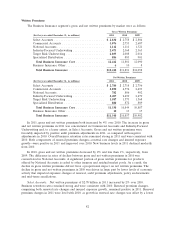
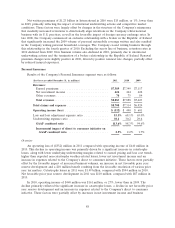
Results of the Company’s Business Insurance segment were as follows:
(for the year ended December 31, in millions) 2011 2010 2009
Revenues:
Earned premiums .......................... $11,327 $10,766 $10,968
Net investment income ...................... 2,041 2,156 1,902
Fee income .............................. 295 285 306
Other revenues ........................... 31 28 42
Total revenues .......................... $13,694 $13,235 $13,218
Total claims and expenses ..................... $12,206 $10,157 $ 9,778
Operating income ........................... $ 1,354 $ 2,301 $ 2,590
Loss and loss adjustment expense ratio ............ 73.1% 59.1% 53.9%
Underwriting expense ratio .................... 31.6 32.2 32.2
GAAP combined ratio ..................... 104.7% 91.3% 86.1%
Overview
Operating income of $1.35 billion in 2011 was $947 million, or 41%, lower than in 2010. The
decrease in 2011 primarily reflected lower net favorable prior year reserve development and a
significant increase in catastrophe losses, along with lower underlying underwriting margins related to
earned pricing and loss cost trends, and lower net investment income. These factors were partially
offset by an increase in business volumes and a $76 million benefit resulting from the favorable
resolution of various prior year tax matters. Net favorable prior year reserve development was
$245 million in 2011, compared with $901 million in 2010. Catastrophe losses in 2011 were
$1.02 billion, compared with $437 million in 2010.
Operating income of $2.30 billion in 2010 was $289 million, or 11%, lower than in 2009. The
decrease in 2010 primarily reflected a significant increase in catastrophe losses, a modest decline in net
favorable prior year reserve development, lower underlying underwriting margins related to earned
pricing and loss cost trends, partially offset by an increase in net investment income and a decline in
general and administrative expenses. In addition, operating income in 2009 included a benefit of
$42 million from the favorable resolution of various prior year tax matters and a $38 million reduction
in the estimate of property windpool assessments related to Hurricane Ike. Catastrophe losses in 2010
were $437 million, compared with $176 million in 2009. Net favorable prior year reserve development
was $901 million in 2010, compared with $1.03 billion in 2009.
Revenues
Earned Premiums
Earned premiums of $11.33 billion in 2011 were $561 million, or 5%, higher than in 2010,
primarily reflecting the impact of an increase in net written premiums over the preceding twelve
months. Earned premiums in 2011 also benefited from positive audit premium adjustments related to
increased insured exposures for existing policyholders, compared with negative audit premium
adjustments in 2010 related to decreased insured exposures for existing policyholders. In 2010, earned
premiums of $10.77 billon were $202 million, or 2%, lower than in 2009, primarily reflecting reduced
insured exposures due to lower levels of economic activity in 2010.
78