Travelers 2011 Annual Report Download - page 34
Download and view the complete annual report
Please find page 34 of the 2011 Travelers annual report below. You can navigate through the pages in the report by either clicking on the pages listed below, or by using the keyword search tool below to find specific information within the annual report.-
 1
1 -
2
-
3
-
4
-
5
-
6
-
7
-
8
-
9
-
10
-
11
-
12
-
13
-
14
-
15
-
16
-
17
-
18
-
19
-
20
-
21
-
22
-
23
-
 24
24 -
 25
25 -
 26
26 -
 27
27 -
 28
28 -
 29
29 -
 30
30 -
 31
31 -
 32
32 -
 33
33 -
 34
34 -
 35
35 -
 36
36 -
 37
37 -
 38
38 -
 39
39 -
 40
40 -
 41
41 -
 42
42 -
 43
43 -
 44
44 -
45
-
46
-
47
-
48
-
49
-
50
-
51
-
52
-
53
-
54
-
55
-
56
-
57
-
58
-
59
-
60
-
61
-
62
-
63
-
64
-
65
-
66
-
67
-
68
-
69
-
70
-
71
-
72
-
73
-
74
-
75
-
76
-
77
-
78
-
79
-
80
-
81
-
82
-
83
-
84
-
85
-
86
-
87
-
88
-
89
-
90
-
91
-
92
-
93
-
94
-
95
-
96
-
97
-
98
-
99
-
100
-
101
-
102
-
103
-
104
-
105
-
106
-
107
-
108
-
109
-
110
-
111
-
112
-
113
-
114
-
115
-
116
-
117
-
118
-
119
-
120
-
121
-
122
-
123
-
124
-
125
-
126
-
127
-
128
-
129
-
130
-
131
-
132
-
133
-
134
-
135
-
136
-
137
-
138
-
139
-
140
-
141
-
142
-
143
-
144
-
145
-
146
-
147
-
148
-
149
-
150
-
151
-
152
-
153
-
154
-
155
-
156
-
157
-
158
-
159
-
160
-
161
-
162
-
163
-
164
-
165
-
166
-
167
-
168
-
169
-
170
-
171
-
172
-
173
-
174
-
175
-
176
-
177
-
178
-
179
-
180
-
181
-
182
-
183
-
184
-
185
-
186
-
187
-
188
-
189
-
190
-
191
-
192
-
193
-
194
-
195
-
196
-
197
-
198
-
199
-
200
-
201
-
202
-
203
-
204
-
205
-
206
-
207
-
208
-
209
-
210
-
211
-
212
-
213
-
214
-
215
-
216
-
217
-
218
-
219
-
220
-
221
-
222
-
223
-
224
-
225
-
226
-
227
-
228
-
229
-
230
-
231
-
232
-
233
-
234
-
235
-
236
-
237
-
238
-
239
-
240
-
241
-
242
-
243
-
244
-
245
-
246
-
247
-
248
-
249
-
250
-
251
-
252
-
253
-
254
-
255
-
256
-
257
-
258
-
259
-
260
-
261
-
262
-
263
-
264
-
265
-
266
-
267
-
268
-
269
-
270
-
271
-
272
-
273
-
274
-
275
-
276
-
277
-
278
-
279
-
280
-
281
-
282
-
283
-
284
-
285
-
286
-
287
-
288
-
289
-
290
-
291
-
292
-
293
 |
 |
Operations’’) are affected by both internal and external events, such as changes in claims handling
procedures, inflation, judicial trends and legislative changes, among others. The impact of many of
these items on ultimate costs for claims and claim adjustment expenses is difficult to estimate. Reserve
estimation difficulties also differ significantly by product line due to differences in the underlying
insurance contract (e.g., claims-made versus occurrence), claim complexity, the volume of claims, the
potential severity of individual claims, the determination of the occurrence date for a claim, and
reporting lags (the time between the occurrence of the insured event and when it is actually reported
to the insurer). Informed judgment is applied throughout the process.
The Company derives estimates for unreported claims and development on reported claims
principally from actuarial analyses of historical patterns of loss development by accident year for each
type of exposure and business unit. Similarly, the Company derives estimates of unpaid loss adjustment
expenses principally from actuarial analyses of historical development patterns of the relationship of
loss adjustment expenses to losses for each line of business and type of exposure. For a description of
the Company’s reserving methods for asbestos and environmental claims, see ‘‘Item 7—Management’s
Discussion and Analysis of Financial Condition and Results of Operations—Asbestos Claims and
Litigation,’’ and ‘‘—Environmental Claims and Litigation.’’
Discounting
The claims and claim adjustment expense reserves for most long-term disability and annuity claim
payments, primarily arising from workers’ compensation insurance and workers’ compensation excess
insurance policies, were discounted to the present value of estimated future payments using a rate of
5% at both December 31, 2011 and 2010. These discounted reserves totaled $2.20 billion and
$2.09 billion at December 31, 2011 and 2010, respectively.
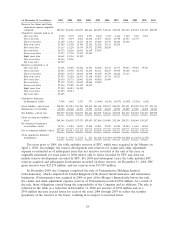
Claims and Claim Adjustment Expense Development Table
The table that follows sets forth the year-end reserves from 2001 through 2011 and the subsequent
changes in those reserves, presented on a historical basis. The original estimates, cumulative amounts
paid and re-estimated reserves in the table for the years 2001 through 2003 have not been restated to
reflect the acquisition by Travelers Property Casualty Corp. (TPC) of The St. Paul Companies, Inc.
(SPC) in 2004 (referred to hereafter as the Merger). The table includes SPC reserves beginning at
December 31, 2004.
The data in the table is presented in accordance with reporting requirements of the Securities and
Exchange Commission (SEC). Care must be taken to avoid misinterpretation by those unfamiliar with
this information or familiar with other data commonly reported by the insurance industry. The data in
the table is not accident year data, but rather a display of 2001 to 2011 year-end reserves and the
subsequent changes in those reserves.
For instance, the ‘‘cumulative deficiency (redundancy)’’ shown in the table for each year represents
the aggregate amount by which original estimates of reserves as of that year-end have changed in
subsequent years. Accordingly, the cumulative deficiency for a year relates only to reserves at that
year-end and those amounts are not additive. Expressed another way, if the original reserves at the end
of 2001 included $4 million for a loss that is finally paid in 2006 for $5 million, the $1 million
deficiency (the excess of the actual payment of $5 million over the original estimate of $4 million)
would be included in the cumulative deficiencies in each of the years 2001 to 2005 shown in the
accompanying table.
Various factors may distort the re-estimated reserves and cumulative deficiency or redundancy
shown in the table. For example, a substantial portion of the cumulative deficiencies shown in the table
arise from claims on policies written prior to the mid-1980s involving liability exposures such as
asbestos and environmental claims. In the post-1984 period, the Company has developed more stringent
22