Travelers 2011 Annual Report Download - page 98
Download and view the complete annual report
Please find page 98 of the 2011 Travelers annual report below. You can navigate through the pages in the report by either clicking on the pages listed below, or by using the keyword search tool below to find specific information within the annual report.-
 1
1 -
2
-
3
-
4
-
5
-
6
-
7
-
8
-
9
-
10
-
11
-
12
-
13
-
14
-
15
-
16
-
17
-
18
-
19
-
20
-
21
-
22
-
23
-
24
-
25
-
26
-
27
-
28
-
29
-
30
-
31
-
32
-
33
-
34
-
35
-
36
-
37
-
38
-
39
-
40
-
41
-
42
-
43
-
44
-
45
-
46
-
47
-
48
-
49
-
50
-
51
-
52
-
53
-
54
-
55
-
56
-
57
-
58
-
59
-
60
-
61
-
62
-
63
-
64
-
65
-
66
-
67
-
68
-
69
-
70
-
71
-
72
-
73
-
74
-
75
-
76
-
77
-
78
-
79
-
80
-
81
-
82
-
83
-
84
-
85
-
86
-
87
-
 88
88 -
 89
89 -
 90
90 -
 91
91 -
 92
92 -
 93
93 -
 94
94 -
 95
95 -
 96
96 -
 97
97 -
 98
98 -
 99
99 -
 100
100 -
 101
101 -
 102
102 -
 103
103 -
 104
104 -
 105
105 -
 106
106 -
 107
107 -
 108
108 -
109
-
110
-
111
-
112
-
113
-
114
-
115
-
116
-
117
-
118
-
119
-
120
-
121
-
122
-
123
-
124
-
125
-
126
-
127
-
128
-
129
-
130
-
131
-
132
-
133
-
134
-
135
-
136
-
137
-
138
-
139
-
140
-
141
-
142
-
143
-
144
-
145
-
146
-
147
-
148
-
149
-
150
-
151
-
152
-
153
-
154
-
155
-
156
-
157
-
158
-
159
-
160
-
161
-
162
-
163
-
164
-
165
-
166
-
167
-
168
-
169
-
170
-
171
-
172
-
173
-
174
-
175
-
176
-
177
-
178
-
179
-
180
-
181
-
182
-
183
-
184
-
185
-
186
-
187
-
188
-
189
-
190
-
191
-
192
-
193
-
194
-
195
-
196
-
197
-
198
-
199
-
200
-
201
-
202
-
203
-
204
-
205
-
206
-
207
-
208
-
209
-
210
-
211
-
212
-
213
-
214
-
215
-
216
-
217
-
218
-
219
-
220
-
221
-
222
-
223
-
224
-
225
-
226
-
227
-
228
-
229
-
230
-
231
-
232
-
233
-
234
-
235
-
236
-
237
-
238
-
239
-
240
-
241
-
242
-
243
-
244
-
245
-
246
-
247
-
248
-
249
-
250
-
251
-
252
-
253
-
254
-
255
-
256
-
257
-
258
-
259
-
260
-
261
-
262
-
263
-
264
-
265
-
266
-
267
-
268
-
269
-
270
-
271
-
272
-
273
-
274
-
275
-
276
-
277
-
278
-
279
-
280
-
281
-
282
-
283
-
284
-
285
-
286
-
287
-
288
-
289
-
290
-
291
-
292
-
293
 |
 |
reserve development in 2009 was driven by better than expected loss development in International,
particularly in the United Kingdom and Canada. In addition, the Aviation and Property lines of
business at Lloyd’s experienced net favorable prior year reserve development in 2009. In Bond &
Financial Products, better than expected loss development for the contract surety business within the
fidelity and surety product line for recent accident years also resulted in net favorable prior year
reserve development in 2009. Catastrophe losses in 2010 and 2009 were $82 million and $3 million,
respectively.
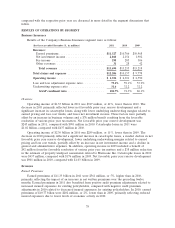
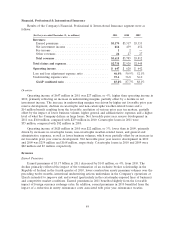
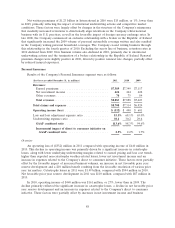
Amortization of Deferred Acquisition Costs
The amortization of deferred acquisition costs was $603 million in 2011, $9 million, or 1%, lower
than in 2010. The decrease in 2011 was less than the decrease in earned premiums, primarily due to
the increase to earned premiums in 2010 as a result of a reduction in surety reinsurance costs
associated with prior year reinsurance treaties. The amortization of deferred acquisition costs was
$612 million in 2010, $10 million, or 2%, lower than in 2009, consistent with the decline in earned
premiums when factoring in the impact on earned premiums in 2010 of the reduction in surety
reinsurance costs associated with prior year reinsurance treaties.
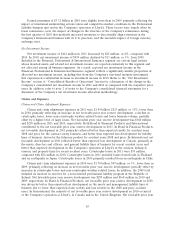
General and Administrative Expenses
General and administrative expenses of $648 million in 2011 were $40 million, or 7%, higher than
in 2010. General and administrative expenses of $608 million in 2010 were $29 million, or 5%, higher
than the 2009 total of $579 million. The increases in both 2011 and 2010 primarily reflecting increases
in employee- and technology-related costs in International to enhance operations and support future
business growth.
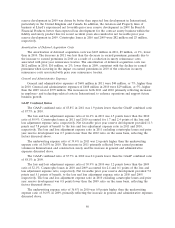
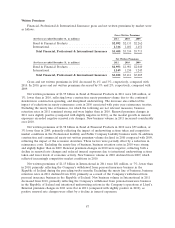
GAAP Combined Ratios
The GAAP combined ratio of 85.8% in 2011 was 1.9 points lower than the GAAP combined ratio
of 87.7% in 2010.
The loss and loss adjustment expense ratio of 46.4% in 2011 was 4.5 points lower than the 2010
ratio of 50.9%. Catastrophe losses in 2011 and 2010 accounted for 1.7 and 2.4 points of the loss and
loss adjustment expense ratio, respectively. Net favorable prior year reserve development provided 11.3
points and 7.8 points of benefit to the loss and loss adjustment expense ratio in 2011 and 2010,
respectively. The loss and loss adjustment expense ratio in 2011 excluding catastrophe losses and prior
year reserve development was 0.3 points lower than the 2010 ratio on the same basis, reflecting the
factors discussed above.
The underwriting expense ratio of 39.4% in 2011 was 2.6 points higher than the underwriting
expense ratio of 36.8% in 2010. The increase in 2011 primarily reflected lower earned premium
volumes in International and construction surety and the increase in general and administrative
expenses discussed above.
The GAAP combined ratio of 87.7% in 2010 was 0.4 points lower than the GAAP combined ratio
of 88.1% in 2009.
The loss and loss adjustment expense ratio of 50.9% in 2010 was 1.2 points lower than the 2009
ratio of 52.1%. Catastrophe losses in 2010 and 2009 accounted for 2.4 and 0.1 points of the loss and
loss adjustment expense ratio, respectively. Net favorable prior year reserve development provided 7.8
points and 5.1 points of benefit, to the loss and loss adjustment expense ratio in 2010 and 2009,
respectively. The loss and loss adjustment expense ratio in 2010 excluding catastrophe losses and prior
year reserve development was 0.8 points lower than the 2009 ratio on the same basis, reflecting the
factors discussed above.
The underwriting expense ratio of 36.8% in 2010 was 0.8 points higher than the underwriting
expense ratio of 36.0% in 2009, primarily reflecting the increase in general and administrative expenses
discussed above.
86