Travelers 2011 Annual Report Download - page 279
Download and view the complete annual report
Please find page 279 of the 2011 Travelers annual report below. You can navigate through the pages in the report by either clicking on the pages listed below, or by using the keyword search tool below to find specific information within the annual report.-
 1
1 -
 2
2 -
 3
3 -
 4
4 -
 5
5 -
 6
6 -
 7
7 -
 8
8 -
 9
9 -
 10
10 -
 11
11 -
 12
12 -
 13
13 -
 14
14 -
 15
15 -
 16
16 -
 17
17 -
 18
18 -
 19
19 -
 20
20 -
 21
21 -
 22
22 -
 23
23 -
 24
24 -
 25
25 -
 26
26 -
 27
27 -
 28
28 -
 29
29 -
 30
30 -
 31
31 -
 32
32 -
 33
33 -
 34
34 -
 35
35 -
 36
36 -
 37
37 -
 38
38 -
 39
39 -
 40
40 -
 41
41 -
 42
42 -
 43
43 -
 44
44 -
 45
45 -
 46
46 -
 47
47 -
 48
48 -
 49
49 -
 50
50 -
 51
51 -
 52
52 -
 53
53 -
 54
54 -
 55
55 -
 56
56 -
 57
57 -
 58
58 -
 59
59 -
 60
60 -
 61
61 -
 62
62 -
 63
63 -
 64
64 -
 65
65 -
 66
66 -
 67
67 -
 68
68 -
 69
69 -
 70
70 -
 71
71 -
 72
72 -
 73
73 -
 74
74 -
 75
75 -
 76
76 -
 77
77 -
 78
78 -
 79
79 -
 80
80 -
 81
81 -
 82
82 -
 83
83 -
 84
84 -
 85
85 -
 86
86 -
 87
87 -
 88
88 -
 89
89 -
 90
90 -
 91
91 -
 92
92 -
 93
93 -
 94
94 -
 95
95 -
 96
96 -
 97
97 -
 98
98 -
 99
99 -
 100
100 -
 101
101 -
 102
102 -
 103
103 -
 104
104 -
 105
105 -
 106
106 -
 107
107 -
 108
108 -
 109
109 -
 110
110 -
 111
111 -
 112
112 -
 113
113 -
 114
114 -
 115
115 -
 116
116 -
 117
117 -
 118
118 -
 119
119 -
 120
120 -
 121
121 -
 122
122 -
 123
123 -
 124
124 -
 125
125 -
 126
126 -
 127
127 -
 128
128 -
 129
129 -
 130
130 -
 131
131 -
 132
132 -
 133
133 -
 134
134 -
 135
135 -
 136
136 -
 137
137 -
 138
138 -
 139
139 -
 140
140 -
 141
141 -
 142
142 -
 143
143 -
 144
144 -
 145
145 -
 146
146 -
 147
147 -
 148
148 -
 149
149 -
 150
150 -
 151
151 -
 152
152 -
 153
153 -
 154
154 -
 155
155 -
 156
156 -
 157
157 -
 158
158 -
 159
159 -
 160
160 -
 161
161 -
 162
162 -
 163
163 -
 164
164 -
 165
165 -
 166
166 -
 167
167 -
 168
168 -
 169
169 -
 170
170 -
 171
171 -
 172
172 -
 173
173 -
 174
174 -
 175
175 -
 176
176 -
 177
177 -
 178
178 -
 179
179 -
 180
180 -
 181
181 -
 182
182 -
 183
183 -
 184
184 -
 185
185 -
 186
186 -
 187
187 -
 188
188 -
 189
189 -
 190
190 -
 191
191 -
 192
192 -
 193
193 -
 194
194 -
 195
195 -
 196
196 -
 197
197 -
 198
198 -
 199
199 -
 200
200 -
 201
201 -
 202
202 -
 203
203 -
 204
204 -
 205
205 -
 206
206 -
 207
207 -
 208
208 -
 209
209 -
 210
210 -
 211
211 -
 212
212 -
 213
213 -
 214
214 -
 215
215 -
 216
216 -
 217
217 -
 218
218 -
 219
219 -
 220
220 -
 221
221 -
 222
222 -
 223
223 -
 224
224 -
 225
225 -
 226
226 -
 227
227 -
 228
228 -
 229
229 -
 230
230 -
 231
231 -
 232
232 -
 233
233 -
 234
234 -
 235
235 -
 236
236 -
 237
237 -
 238
238 -
 239
239 -
 240
240 -
 241
241 -
 242
242 -
 243
243 -
 244
244 -
 245
245 -
 246
246 -
 247
247 -
 248
248 -
 249
249 -
 250
250 -
 251
251 -
 252
252 -
 253
253 -
 254
254 -
 255
255 -
 256
256 -
 257
257 -
 258
258 -
 259
259 -
 260
260 -
 261
261 -
 262
262 -
 263
263 -
 264
264 -
 265
265 -
 266
266 -
 267
267 -
 268
268 -
 269
269 -
 270
270 -
 271
271 -
 272
272 -
 273
273 -
 274
274 -
 275
275 -
 276
276 -
 277
277 -
 278
278 -
 279
279 -
 280
280 -
 281
281 -
 282
282 -
 283
283 -
 284
284 -
 285
285 -
 286
286 -
 287
287 -
 288
288 -
 289
289 -
 290
290 -
 291
291 -
 292
292 -
 293
293
 |
 |

267
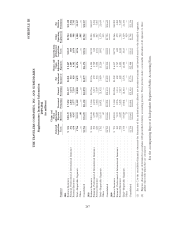
SCHEDULE III
THE TRAVELERS COMPANIES, INC. AND SUBSIDIARIES
Supplementary Insurance Information
2009-2011
(in millions)
Claims and
Claim Claims and Amortization
Deferred Adjustment Net Claim of Deferred Other Net
Acquisition Expense Unearned Earned Investment Adjustment Acquisition Operating Written
Segment Costs Reserves Premiums Premiums Income(1) Expenses Costs Expenses(2) Premiums
2011
Business Insurance .......................... $ 816 $40,129 $ 5,482 $11,327 $2,041 $ 8,447 $1,815 $1,944 $11,340
Financial, Professional & International Insurance ...... 332 6,857 2,043 3,174 414 1,487 603 648 3,102
Personal Insurance .......................... 638 4,367 3,577 7,589 424 6,342 1,458 908 7,745
Total—Reportable Segments .................... 1,786 51,353 11,102 22,090 2,879 16,276 3,876 3,500 22,187
Other .................................. — 66 — — — — — 442 —
Consolidated ............................. $1,786 $51,419 $11,102 $22,090 $2,879 $16,276 $3,876 $3,942 $22,187
2010
Business Insurance .......................... $ 806 $40,318 $ 5,364 $10,766 $2,156 $ 6,504 $1,749 $1,904 $10,857
Financial, Professional & International Insurance ...... 352 6,999 2,139 3,317 439 1,700 612 608 3,211
Personal Insurance .......................... 624 4,220 3,418 7,349 464 5,006 1,441 867 7,567
Total—Reportable Segments .................... 1,782 51,537 10,921 21,432 3,059 13,210 3,802 3,379 21,635
Other .................................. — 69 — — — — — 415 —
Consolidated ............................. $1,782 $51,606 $10,921 $21,432 $3,059 $13,210 $3,802 $3,794 $21,635
2009
Business Insurance .......................... $ 791 $42,103 $ 5,380 $10,968 $1,902 $ 6,037 $1,775 $1,966 $10,902
Financial, Professional & International Insurance ...... 369 7,197 2,276 3,333 452 1,747 622 579 3,285
Personal Insurance .......................... 598 4,229 3,205 7,117 422 4,624 1,416 784 7,149
Total—Reportable Segments .................... 1,758 53,529 10,861 21,418 2,776 12,408 3,813 3,329 21,336
Other .................................. — 73 — — — — — 419 —
Consolidated ............................. $1,758 $53,602 $10,861 $21,418 $2,776 $12,408 $3,813 $3,748 $21,336
(1) See note 2 to the consolidated financial statements for discussion of the method used to allocate net investment income and invested assets to the identified segments.
(2) Expense allocations are determined in accordance with prescribed statutory accounting practices. These practices make a reasonable allocation of all expenses to those
product lines with which they are associated.
See the accompanying Report of Independent Registered Public Accounting Firm.
