Travelers 2011 Annual Report Download - page 93
Download and view the complete annual report
Please find page 93 of the 2011 Travelers annual report below. You can navigate through the pages in the report by either clicking on the pages listed below, or by using the keyword search tool below to find specific information within the annual report.-
 1
1 -
2
-
3
-
4
-
5
-
6
-
7
-
8
-
9
-
10
-
11
-
12
-
13
-
14
-
15
-
16
-
17
-
18
-
19
-
20
-
21
-
22
-
23
-
24
-
25
-
26
-
27
-
28
-
29
-
30
-
31
-
32
-
33
-
34
-
35
-
36
-
37
-
38
-
39
-
40
-
41
-
42
-
43
-
44
-
45
-
46
-
47
-
48
-
49
-
50
-
51
-
52
-
53
-
54
-
55
-
56
-
57
-
58
-
59
-
60
-
61
-
62
-
63
-
64
-
65
-
66
-
67
-
68
-
69
-
70
-
71
-
72
-
73
-
74
-
75
-
76
-
77
-
78
-
79
-
80
-
81
-
82
-
 83
83 -
 84
84 -
 85
85 -
 86
86 -
 87
87 -
 88
88 -
 89
89 -
 90
90 -
 91
91 -
 92
92 -
 93
93 -
 94
94 -
 95
95 -
 96
96 -
 97
97 -
 98
98 -
 99
99 -
 100
100 -
 101
101 -
 102
102 -
 103
103 -
104
-
105
-
106
-
107
-
108
-
109
-
110
-
111
-
112
-
113
-
114
-
115
-
116
-
117
-
118
-
119
-
120
-
121
-
122
-
123
-
124
-
125
-
126
-
127
-
128
-
129
-
130
-
131
-
132
-
133
-
134
-
135
-
136
-
137
-
138
-
139
-
140
-
141
-
142
-
143
-
144
-
145
-
146
-
147
-
148
-
149
-
150
-
151
-
152
-
153
-
154
-
155
-
156
-
157
-
158
-
159
-
160
-
161
-
162
-
163
-
164
-
165
-
166
-
167
-
168
-
169
-
170
-
171
-
172
-
173
-
174
-
175
-
176
-
177
-
178
-
179
-
180
-
181
-
182
-
183
-
184
-
185
-
186
-
187
-
188
-
189
-
190
-
191
-
192
-
193
-
194
-
195
-
196
-
197
-
198
-
199
-
200
-
201
-
202
-
203
-
204
-
205
-
206
-
207
-
208
-
209
-
210
-
211
-
212
-
213
-
214
-
215
-
216
-
217
-
218
-
219
-
220
-
221
-
222
-
223
-
224
-
225
-
226
-
227
-
228
-
229
-
230
-
231
-
232
-
233
-
234
-
235
-
236
-
237
-
238
-
239
-
240
-
241
-
242
-
243
-
244
-
245
-
246
-
247
-
248
-
249
-
250
-
251
-
252
-
253
-
254
-
255
-
256
-
257
-
258
-
259
-
260
-
261
-
262
-
263
-
264
-
265
-
266
-
267
-
268
-
269
-
270
-
271
-
272
-
273
-
274
-
275
-
276
-
277
-
278
-
279
-
280
-
281
-
282
-
283
-
284
-
285
-
286
-
287
-
288
-
289
-
290
-
291
-
292
-
293
 |
 |
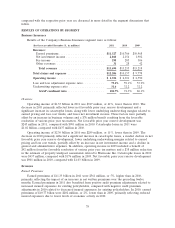
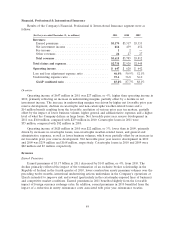
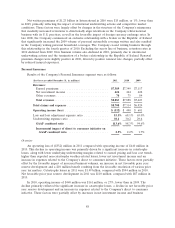
General and Administrative Expenses
General and administrative expenses in 2011 were $1.94 billion, $40 million, or 2%, higher than in
2010, primarily driven by a higher level of state assessment expenses related to workers’ compensation
business in New York, which more than offset an overall reduction in operating expenses.
General and administrative expenses in 2010 were $1.90 billion, $62 million, or 3%, lower than in
2009. The 2009 total included a $38 million reduction in the estimate of property windpool assessments
related to Hurricane Ike. Adjusting for that reduction in 2009, general and administrative expenses in
2010 were $100 million, or 5%, lower than in 2009, driven by a decline in loss-based assessments that
reflected the impact of favorable prior year reserve development and favorable rate changes, as well as
a decline in employee-related expenses and a reduction in the amount of the Company’s corporate
advertising expense allocated to this segment resulting from a change in focus to the Personal
Insurance segment’s direct to consumer initiative in 2010.
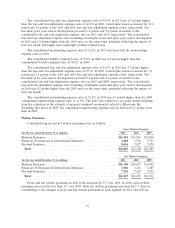
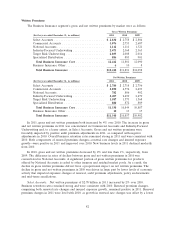
GAAP Combined Ratios
The GAAP combined ratio of 104.7% in 2011 was 13.4 points higher than the GAAP combined
ratio of 91.3% in 2010.
In 2011, the loss and loss adjustment expense ratio of 73.1% was 14.0 points higher than the 2010
ratio of 59.1%. Catastrophe losses in 2011 and 2010 accounted for 9.0 points and 4.1 points of the loss
and loss adjustment expense ratio, respectively. Net favorable prior year reserve development provided
2.2 points and 8.4 points of benefit to the loss and loss adjustment expense ratio in 2011 and 2010,
respectively. The loss and loss adjustment expense ratio in 2011 excluding catastrophe losses and prior
year reserve development was 2.9 points higher than the 2010 ratio on the same basis, reflecting the
impact of loss cost trends described above.
The underwriting expense ratio of 31.6% in 2011 was 0.6 points lower than the 2010 underwriting
expense ratio, primarily reflecting the impact of higher earned premiums.
The GAAP combined ratio of 91.3% in 2010 was 5.2 points higher than the GAAP combined ratio
of 86.1% in 2009.
In 2010, the loss and loss adjustment expense ratio of 59.1% was 5.2 points higher than the 2009
ratio of 53.9%. Catastrophe losses in 2010 and 2009 accounted for 4.1 points and 1.6 points of the loss
and loss adjustment expense ratio, respectively. Net favorable prior year reserve development provided
8.4 points and 9.3 points of benefit to the loss and loss adjustment expense ratio in 2010 and 2009,
respectively. The loss and loss adjustment expense ratio in 2010 excluding catastrophe losses and prior
year reserve development was 1.8 points higher than the 2009 ratio on the same basis, reflecting the
impact of loss cost trends described above.
The underwriting expense ratio of 32.2% in 2010 was level with the 2009 underwriting expense
ratio. The underwriting expense ratio in 2009 included a 0.3 point benefit from the reduction in the
estimate of windpool assessments described above. Adjusting for that factor in 2009, the underwriting
expense ratio for 2010 was 0.3 points lower than the 2009 underwriting expense ratio. The improvement
in the 2010 adjusted underwriting expense ratio reflected the decline in expenses described above.
81