Travelers 2011 Annual Report Download - page 48
Download and view the complete annual report
Please find page 48 of the 2011 Travelers annual report below. You can navigate through the pages in the report by either clicking on the pages listed below, or by using the keyword search tool below to find specific information within the annual report.-
 1
1 -
2
-
3
-
4
-
5
-
6
-
7
-
8
-
9
-
10
-
11
-
12
-
13
-
14
-
15
-
16
-
17
-
18
-
19
-
20
-
21
-
22
-
23
-
24
-
25
-
26
-
27
-
28
-
29
-
30
-
31
-
32
-
33
-
34
-
35
-
36
-
37
-
 38
38 -
 39
39 -
 40
40 -
 41
41 -
 42
42 -
 43
43 -
 44
44 -
 45
45 -
 46
46 -
 47
47 -
 48
48 -
 49
49 -
 50
50 -
 51
51 -
 52
52 -
 53
53 -
 54
54 -
 55
55 -
 56
56 -
 57
57 -
 58
58 -
59
-
60
-
61
-
62
-
63
-
64
-
65
-
66
-
67
-
68
-
69
-
70
-
71
-
72
-
73
-
74
-
75
-
76
-
77
-
78
-
79
-
80
-
81
-
82
-
83
-
84
-
85
-
86
-
87
-
88
-
89
-
90
-
91
-
92
-
93
-
94
-
95
-
96
-
97
-
98
-
99
-
100
-
101
-
102
-
103
-
104
-
105
-
106
-
107
-
108
-
109
-
110
-
111
-
112
-
113
-
114
-
115
-
116
-
117
-
118
-
119
-
120
-
121
-
122
-
123
-
124
-
125
-
126
-
127
-
128
-
129
-
130
-
131
-
132
-
133
-
134
-
135
-
136
-
137
-
138
-
139
-
140
-
141
-
142
-
143
-
144
-
145
-
146
-
147
-
148
-
149
-
150
-
151
-
152
-
153
-
154
-
155
-
156
-
157
-
158
-
159
-
160
-
161
-
162
-
163
-
164
-
165
-
166
-
167
-
168
-
169
-
170
-
171
-
172
-
173
-
174
-
175
-
176
-
177
-
178
-
179
-
180
-
181
-
182
-
183
-
184
-
185
-
186
-
187
-
188
-
189
-
190
-
191
-
192
-
193
-
194
-
195
-
196
-
197
-
198
-
199
-
200
-
201
-
202
-
203
-
204
-
205
-
206
-
207
-
208
-
209
-
210
-
211
-
212
-
213
-
214
-
215
-
216
-
217
-
218
-
219
-
220
-
221
-
222
-
223
-
224
-
225
-
226
-
227
-
228
-
229
-
230
-
231
-
232
-
233
-
234
-
235
-
236
-
237
-
238
-
239
-
240
-
241
-
242
-
243
-
244
-
245
-
246
-
247
-
248
-
249
-
250
-
251
-
252
-
253
-
254
-
255
-
256
-
257
-
258
-
259
-
260
-
261
-
262
-
263
-
264
-
265
-
266
-
267
-
268
-
269
-
270
-
271
-
272
-
273
-
274
-
275
-
276
-
277
-
278
-
279
-
280
-
281
-
282
-
283
-
284
-
285
-
286
-
287
-
288
-
289
-
290
-
291
-
292
-
293
 |
 |
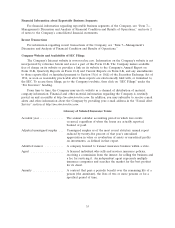
Assigned risk pools .......... Reinsurance pools which cover risks for those unable to purchase
insurance in the voluntary market. Possible reasons for this inability
include the risk being too great or the profit being too small under
the required insurance rate structure. The costs of the risks
associated with these pools are charged back to insurance carriers
in proportion to their direct writings.
Assumed reinsurance ........ Insurance risks acquired from a ceding company.
Average value analysis ....... A conventional actuarial method used to estimate ultimate losses
for a given cohort of claims such as an accident year/product line
component. If the paid-to-date losses are then subtracted from the
estimated ultimate losses, the result is an indication of the unpaid
losses.
The basic premise of the method is that average claim values are
stable and predictable over time for a particular cohort of claims.
The method is utilized most often where ultimate claim counts are
known or reliably estimable fairly early after the start of an accident
year and average values are expected to be fairly predictable from
one year to the next.
The method comes up with an estimate of ultimate claims counts by
accident year cohort, and multiplies it by an estimate of average
claim value by accident year cohort, with multiple methods used to
estimate these average claim values.
Book value per share ........ Total common shareholders’ equity divided by the number of
common shares outstanding.
Bornhuetter-Ferguson method . . A conventional actuarial method to estimate ultimate losses for a
given cohort of claims such as an accident year/product line
component. If the paid-to-date losses are then subtracted from the
estimated ultimate losses, the result is an indication of the
outstanding losses.
The basic premise of the method is that the historical ratio of
additional claim activity to earned premium for a given product line
component/age-to-age period is stable and predictable. It implicitly
assumes that the actual activity to date for past periods for that
cohort is not a credible predictor of future activity for that cohort,
or at least is not credible enough to override the ‘‘a priori’’
assumption as to future activity. It may be applied to either paid or
case incurred claim data. It is used most often where the claim data
is sparse and/or volatile and for relatively young cohorts with low
volumes and/or data credibility.
To illustrate, the method may assume that the ratio of additional
paid losses from the 12 to 24 month period for an accident year is
10% of the original ‘‘a priori’’ expected losses for that accident
year. The original ‘‘a priori’’ expected losses are typically based on
the original loss ratio assumption for that accident year, with
subsequent adjustment as facts develop.
36