Travelers 2011 Annual Report Download - page 84
Download and view the complete annual report
Please find page 84 of the 2011 Travelers annual report below. You can navigate through the pages in the report by either clicking on the pages listed below, or by using the keyword search tool below to find specific information within the annual report.-
 1
1 -
2
-
3
-
4
-
5
-
6
-
7
-
8
-
9
-
10
-
11
-
12
-
13
-
14
-
15
-
16
-
17
-
18
-
19
-
20
-
21
-
22
-
23
-
24
-
25
-
26
-
27
-
28
-
29
-
30
-
31
-
32
-
33
-
34
-
35
-
36
-
37
-
38
-
39
-
40
-
41
-
42
-
43
-
44
-
45
-
46
-
47
-
48
-
49
-
50
-
51
-
52
-
53
-
54
-
55
-
56
-
57
-
58
-
59
-
60
-
61
-
62
-
63
-
64
-
65
-
66
-
67
-
68
-
69
-
70
-
71
-
72
-
73
-
 74
74 -
 75
75 -
 76
76 -
 77
77 -
 78
78 -
 79
79 -
 80
80 -
 81
81 -
 82
82 -
 83
83 -
 84
84 -
 85
85 -
 86
86 -
 87
87 -
 88
88 -
 89
89 -
 90
90 -
 91
91 -
 92
92 -
 93
93 -
 94
94 -
95
-
96
-
97
-
98
-
99
-
100
-
101
-
102
-
103
-
104
-
105
-
106
-
107
-
108
-
109
-
110
-
111
-
112
-
113
-
114
-
115
-
116
-
117
-
118
-
119
-
120
-
121
-
122
-
123
-
124
-
125
-
126
-
127
-
128
-
129
-
130
-
131
-
132
-
133
-
134
-
135
-
136
-
137
-
138
-
139
-
140
-
141
-
142
-
143
-
144
-
145
-
146
-
147
-
148
-
149
-
150
-
151
-
152
-
153
-
154
-
155
-
156
-
157
-
158
-
159
-
160
-
161
-
162
-
163
-
164
-
165
-
166
-
167
-
168
-
169
-
170
-
171
-
172
-
173
-
174
-
175
-
176
-
177
-
178
-
179
-
180
-
181
-
182
-
183
-
184
-
185
-
186
-
187
-
188
-
189
-
190
-
191
-
192
-
193
-
194
-
195
-
196
-
197
-
198
-
199
-
200
-
201
-
202
-
203
-
204
-
205
-
206
-
207
-
208
-
209
-
210
-
211
-
212
-
213
-
214
-
215
-
216
-
217
-
218
-
219
-
220
-
221
-
222
-
223
-
224
-
225
-
226
-
227
-
228
-
229
-
230
-
231
-
232
-
233
-
234
-
235
-
236
-
237
-
238
-
239
-
240
-
241
-
242
-
243
-
244
-
245
-
246
-
247
-
248
-
249
-
250
-
251
-
252
-
253
-
254
-
255
-
256
-
257
-
258
-
259
-
260
-
261
-
262
-
263
-
264
-
265
-
266
-
267
-
268
-
269
-
270
-
271
-
272
-
273
-
274
-
275
-
276
-
277
-
278
-
279
-
280
-
281
-
282
-
283
-
284
-
285
-
286
-
287
-
288
-
289
-
290
-
291
-
292
-
293
 |
 |

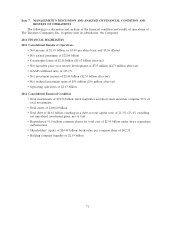
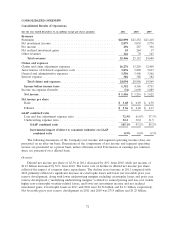
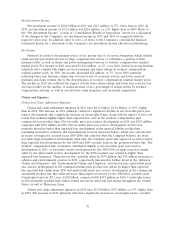
CONSOLIDATED OVERVIEW
Consolidated Results of Operations
(for the year ended December 31, in millions except per share amounts) 2011 2010 2009
Revenues
Premiums .............................................. $22,090 $21,432 $21,418
Net investment income ..................................... 2,879 3,059 2,776
Fee income ............................................. 296 287 306
Net realized investment gains ................................ 55 264 17
Other revenues .......................................... 126 70 163
Total revenues ........................................ 25,446 25,112 24,680
Claims and expenses
Claims and claim adjustment expenses .......................... 16,276 13,210 12,408
Amortization of deferred acquisition costs ....................... 3,876 3,802 3,813
General and administrative expenses ........................... 3,556 3,406 3,366
Interest expense .......................................... 386 388 382
Total claims and expenses ............................... 24,094 20,806 19,969
Income before income taxes ................................ 1,352 4,306 4,711
Income tax expense (benefit) ................................ (74) 1,090 1,089
Net income ............................................ $ 1,426 $ 3,216 $ 3,622
Net income per share
Basic ................................................ $ 3.40 $ 6.69 $ 6.38
Diluted .............................................. $ 3.36 $ 6.62 $ 6.33
GAAP combined ratio
Loss and loss adjustment expense ratio ....................... 72.9% 61.0% 57.3%
Underwriting expense ratio ................................ 32.2 32.2 31.9
GAAP combined ratio ................................. 105.1% 93.2% 89.2%
Incremental impact of direct to consumer initiative on GAAP
combined ratio .................................... 0.9% 0.8% 0.5%
The following discussions of the Company’s net income and segment operating income (loss) are
presented on an after-tax basis. Discussions of the components of net income and segment operating
income are presented on a pretax basis, unless otherwise noted. Discussions of earnings per common
share are presented on a diluted basis.
Overview
Diluted net income per share of $3.36 in 2011 decreased by 49% from 2010, while net income of
$1.43 billion decreased by 56% from 2010. The lower rate of decline in diluted net income per share
reflected the impact of common share repurchases. The decline in net income in 2011 compared with
2010 primarily reflected a significant increase in catastrophe losses and lower net favorable prior year
reserve development, along with lower underwriting margins excluding catastrophe losses and prior year
reserve development (‘‘underlying underwriting margins’’) related to earned pricing and loss cost trends,
higher non-catastrophe weather-related losses, and lower net investment income and net realized
investment gains. Catastrophe losses in 2011 and 2010 were $2.56 billion and $1.11 billion, respectively.
Net favorable prior year reserve development in 2011 and 2010 was $715 million and $1.25 billion,
72