Travelers 2011 Annual Report Download - page 95
Download and view the complete annual report
Please find page 95 of the 2011 Travelers annual report below. You can navigate through the pages in the report by either clicking on the pages listed below, or by using the keyword search tool below to find specific information within the annual report.-
 1
1 -
2
-
3
-
4
-
5
-
6
-
7
-
8
-
9
-
10
-
11
-
12
-
13
-
14
-
15
-
16
-
17
-
18
-
19
-
20
-
21
-
22
-
23
-
24
-
25
-
26
-
27
-
28
-
29
-
30
-
31
-
32
-
33
-
34
-
35
-
36
-
37
-
38
-
39
-
40
-
41
-
42
-
43
-
44
-
45
-
46
-
47
-
48
-
49
-
50
-
51
-
52
-
53
-
54
-
55
-
56
-
57
-
58
-
59
-
60
-
61
-
62
-
63
-
64
-
65
-
66
-
67
-
68
-
69
-
70
-
71
-
72
-
73
-
74
-
75
-
76
-
77
-
78
-
79
-
80
-
81
-
82
-
83
-
84
-
 85
85 -
 86
86 -
 87
87 -
 88
88 -
 89
89 -
 90
90 -
 91
91 -
 92
92 -
 93
93 -
 94
94 -
 95
95 -
 96
96 -
 97
97 -
 98
98 -
 99
99 -
 100
100 -
 101
101 -
 102
102 -
 103
103 -
 104
104 -
 105
105 -
106
-
107
-
108
-
109
-
110
-
111
-
112
-
113
-
114
-
115
-
116
-
117
-
118
-
119
-
120
-
121
-
122
-
123
-
124
-
125
-
126
-
127
-
128
-
129
-
130
-
131
-
132
-
133
-
134
-
135
-
136
-
137
-
138
-
139
-
140
-
141
-
142
-
143
-
144
-
145
-
146
-
147
-
148
-
149
-
150
-
151
-
152
-
153
-
154
-
155
-
156
-
157
-
158
-
159
-
160
-
161
-
162
-
163
-
164
-
165
-
166
-
167
-
168
-
169
-
170
-
171
-
172
-
173
-
174
-
175
-
176
-
177
-
178
-
179
-
180
-
181
-
182
-
183
-
184
-
185
-
186
-
187
-
188
-
189
-
190
-
191
-
192
-
193
-
194
-
195
-
196
-
197
-
198
-
199
-
200
-
201
-
202
-
203
-
204
-
205
-
206
-
207
-
208
-
209
-
210
-
211
-
212
-
213
-
214
-
215
-
216
-
217
-
218
-
219
-
220
-
221
-
222
-
223
-
224
-
225
-
226
-
227
-
228
-
229
-
230
-
231
-
232
-
233
-
234
-
235
-
236
-
237
-
238
-
239
-
240
-
241
-
242
-
243
-
244
-
245
-
246
-
247
-
248
-
249
-
250
-
251
-
252
-
253
-
254
-
255
-
256
-
257
-
258
-
259
-
260
-
261
-
262
-
263
-
264
-
265
-
266
-
267
-
268
-
269
-
270
-
271
-
272
-
273
-
274
-
275
-
276
-
277
-
278
-
279
-
280
-
281
-
282
-
283
-
284
-
285
-
286
-
287
-
288
-
289
-
290
-
291
-
292
-
293
 |
 |
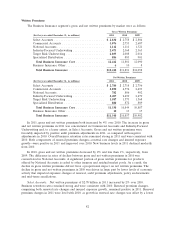
level of insured exposure growth. New business volume in 2011 declined from 2010. Net written
premiums of $2.72 billion in 2010 decreased 1% from 2009. Business retention rates in 2010 remained
strong but were slightly lower than in 2009. Renewal premium changes remained positive in 2010 and
increased over 2009, reflecting positive renewal rate changes and modest exposure growth. New
business volume in 2010 declined compared with 2009, driven by lower business volumes from larger
accounts where marketplace competition remained high.
Commercial Accounts. Net written premiums of $2.89 billion in 2011 increased by 12% over 2010.
The increase was partially due to the benefit of positive audit premium adjustments, compared with
negative adjustments in 2010. Business retention rates remained strong, decreasing slightly in 2011
compared with 2010. Renewal premium changes were positive in 2011 and increased over 2010,
primarily driven by positive renewal rate changes. New business volume in 2011 declined slightly from
2010. Net written premiums of $2.58 billion in 2010 were 3% higher than in 2009. Business retention
rates in 2010 remained strong and increased slightly over 2009. Renewal premium changes in 2010 were
slightly positive, as positive renewal rate changes were largely offset by a modest decline in exposures
that reflected the impact of general economic conditions. New business levels also increased over 2009.
National Accounts. Net written premiums of $782 million in 2011 decreased by 3% from 2010,
primarily reflecting negative retrospective premium adjustments related to prior year policies. Business
retention rates remained high in 2011 and increased slightly over 2010, while renewal premium changes
in 2011 also increased over 2010. New business volume in 2011 declined slightly from 2010. Net written
premiums of $806 million in 2010 were 11% lower than in 2009, reflecting reduced insurance exposures
driven by lower levels of economic activity, lower prior year retrospective premium adjustments and the
loss of a large account. Despite the loss of that account, business retention rates remained high in 2010.
Industry-Focused Underwriting. Net written premiums of $2.41 billion in 2011 increased by 5%
over 2010, primarily driven by growth in Construction, Oil & Gas and Technology. Net written
premiums of $2.30 billion in 2010 increased 1% over 2009. Premium growth in 2010 was concentrated
in the Technology, Agribusiness and Oil & Gas business units.
Target Risk Underwriting. Net written premiums of $1.59 billion in 2011 increased slightly over
2010, as premium growth in Inland Marine and Excess Casualty was largely offset by a decline in
National Property. Net written premiums of $1.57 billion in 2010 were slightly higher than in 2009, as
premium growth in the Boiler & Machinery and Inland Marine business units was largely offset by a
decline in National Property premium volume.
Specialized Distribution. Net written premiums of $880 million in 2011 increased slightly over
2010, driven by growth in the National Programs business unit. Net written premiums of $872 million in
2010 were 2% lower than in 2009, primarily driven by negative renewal premium changes in both the
Northland and National Programs business units. Business retention rates in both business units
increased over 2009.
83