Travelers 2011 Annual Report Download - page 36
Download and view the complete annual report
Please find page 36 of the 2011 Travelers annual report below. You can navigate through the pages in the report by either clicking on the pages listed below, or by using the keyword search tool below to find specific information within the annual report.-
 1
1 -
2
-
3
-
4
-
5
-
6
-
7
-
8
-
9
-
10
-
11
-
12
-
13
-
14
-
15
-
16
-
17
-
18
-
19
-
20
-
21
-
22
-
23
-
24
-
25
-
 26
26 -
 27
27 -
 28
28 -
 29
29 -
 30
30 -
 31
31 -
 32
32 -
 33
33 -
 34
34 -
 35
35 -
 36
36 -
 37
37 -
 38
38 -
 39
39 -
 40
40 -
 41
41 -
 42
42 -
 43
43 -
 44
44 -
 45
45 -
 46
46 -
47
-
48
-
49
-
50
-
51
-
52
-
53
-
54
-
55
-
56
-
57
-
58
-
59
-
60
-
61
-
62
-
63
-
64
-
65
-
66
-
67
-
68
-
69
-
70
-
71
-
72
-
73
-
74
-
75
-
76
-
77
-
78
-
79
-
80
-
81
-
82
-
83
-
84
-
85
-
86
-
87
-
88
-
89
-
90
-
91
-
92
-
93
-
94
-
95
-
96
-
97
-
98
-
99
-
100
-
101
-
102
-
103
-
104
-
105
-
106
-
107
-
108
-
109
-
110
-
111
-
112
-
113
-
114
-
115
-
116
-
117
-
118
-
119
-
120
-
121
-
122
-
123
-
124
-
125
-
126
-
127
-
128
-
129
-
130
-
131
-
132
-
133
-
134
-
135
-
136
-
137
-
138
-
139
-
140
-
141
-
142
-
143
-
144
-
145
-
146
-
147
-
148
-
149
-
150
-
151
-
152
-
153
-
154
-
155
-
156
-
157
-
158
-
159
-
160
-
161
-
162
-
163
-
164
-
165
-
166
-
167
-
168
-
169
-
170
-
171
-
172
-
173
-
174
-
175
-
176
-
177
-
178
-
179
-
180
-
181
-
182
-
183
-
184
-
185
-
186
-
187
-
188
-
189
-
190
-
191
-
192
-
193
-
194
-
195
-
196
-
197
-
198
-
199
-
200
-
201
-
202
-
203
-
204
-
205
-
206
-
207
-
208
-
209
-
210
-
211
-
212
-
213
-
214
-
215
-
216
-
217
-
218
-
219
-
220
-
221
-
222
-
223
-
224
-
225
-
226
-
227
-
228
-
229
-
230
-
231
-
232
-
233
-
234
-
235
-
236
-
237
-
238
-
239
-
240
-
241
-
242
-
243
-
244
-
245
-
246
-
247
-
248
-
249
-
250
-
251
-
252
-
253
-
254
-
255
-
256
-
257
-
258
-
259
-
260
-
261
-
262
-
263
-
264
-
265
-
266
-
267
-
268
-
269
-
270
-
271
-
272
-
273
-
274
-
275
-
276
-
277
-
278
-
279
-
280
-
281
-
282
-
283
-
284
-
285
-
286
-
287
-
288
-
289
-
290
-
291
-
292
-
293
 |
 |

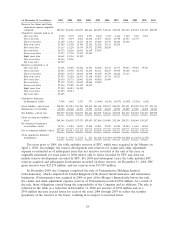
(at December 31, in millions) 2001 2002 2003 2004 2005 2006 2007 2008 2009 2010 2011
Reserves for claims and claim
adjustment expense originally
estimated ............. $20,197 $23,268 $24,055 $41,446 $42,895 $42,844 $43,098 $41,312 $40,941 $40,255 $40,919
Cumulative amounts paid as of
One year later .......... 5,018 5,170 4,651 8,871 8,632 7,417 8,146 7,519 7,748 7,653
Two years later .......... 8,745 8,319 8,686 14,666 13,837 13,181 12,798 12,454 12,374
Three years later ......... 11,149 11,312 11,541 18,733 18,466 16,545 16,264 15,668
Four years later ......... 13,402 13,548 13,708 22,514 21,025 19,113 18,524
Five years later .......... 15,115 15,229 15,574 24,572 22,992 20,820
Six years later ........... 16,473 16,836 16,624 26,189 24,423
Seven years later ......... 17,877 17,738 17,558 27,469
Eight years later ......... 18,662 18,563 18,320
Nine years later ......... 19,416 19,236
Ten years later .......... 20,039
Reserves re-estimated as of
One year later .......... 23,228 23,658 24,222 41,706 42,466 42,172 41,373 39,863 39,524 39,413
Two years later .......... 24,083 24,592 25,272 42,565 42,311 40,837 39,925 38,640 38,421
Three years later ......... 25,062 25,553 26,042 42,940 41,692 39,739 38,842 37,613
Four years later ......... 25,953 26,288 26,501 43,148 40,855 38,734 38,223
Five years later .......... 26,670 26,731 26,803 42,655 40,026 38,409
Six years later ........... 27,179 27,055 26,619 42,068 39,849
Seven years later ......... 27,556 27,022 26,342 42,019
Eight years later ......... 27,580 26,815 26,382
Nine years later ......... 27,496 26,911
Ten years later .......... 27,605
Cumulative deficiency
(redundancy) (a)(b) ....... 7,408 3,643 2,327 573 (3,046) (4,435) (4,875) (3,699) (2,520) (842)
Gross liability—end of year . . . $30,903 $33,914 $34,760 $59,438 $61,461 $59,677 $58,094 $55,121 $53,529 $51,537 $51,353
Reinsurance recoverables ..... 10,706 10,646 10,705 17,992 18,566 16,833 14,996 13,809 12,588 11,282 10,434
Net liability—end of year ..... $20,197 $23,268 $24,055 $41,446 $42,895 $42,844 $43,098 $41,312 $40,941 $40,255 $40,919
Gross re-estimated liability—
latest ................ $40,348 $38,892 $37,475 $59,859 $57,860 $54,008 $52,144 $50,233 $50,064 $50,267
Re-estimated reinsurance
recoverables—latest ....... 12,743 11,981 11,093 17,840 18,011 15,599 13,921 12,620 11,643 10,854
Net re-estimated liability—latest $27,605 $26,911 $26,382 $42,019 $39,849 $38,409 $38,223 $37,613 $38,421 $39,413
Gross cumulative deficiency
(redundancy) ........... $9,445 $ 4,978 $ 2,715 $ 421 $(3,601) $ (5,669) $ (5,950) $ (4,888) $ (3,465) $(1,270)
For years prior to 2004, the table excludes reserves of SPC, which were acquired in the Merger on
April 1, 2004. Accordingly, the reserve development (net reserves for claims and claim adjustment
expense re-estimated as of subsequent years less net reserves recorded at the end of the year, as
originally estimated) for years prior to 2004 relates only to losses recorded by TPC and does not
include reserve development recorded by SPC. For 2004 and subsequent years, the table includes SPC
reserves acquired and subsequent development recorded on those reserves. At December 31, 2004, SPC
gross reserves were $23,274 million, and net reserves were $15,959 million.
In December 2008, the Company completed the sale of Unionamerica Holdings Limited
(Unionamerica), which comprised its United Kingdom (U.K.)-based runoff insurance and reinsurance
businesses. (Unionamerica was acquired in 2004 as part of the Merger.) Immediately before the sale,
the claims and claim adjustment expense reserves of Unionamerica totaled $790 million. As a result of
the sale, those obligations ceased being the responsibility of the Company and its affiliates. The sale is
reflected in the table as a reduction in December 31, 2008 net reserves of $790 million and as a
$790 million increase in paid losses for each of the years 2004 through 2007 to reflect the transfer
(payment) of the reserves to the buyer, resulting in no impact to incurred losses.
24