Travelers 2011 Annual Report Download - page 37
Download and view the complete annual report
Please find page 37 of the 2011 Travelers annual report below. You can navigate through the pages in the report by either clicking on the pages listed below, or by using the keyword search tool below to find specific information within the annual report.-
 1
1 -
2
-
3
-
4
-
5
-
6
-
7
-
8
-
9
-
10
-
11
-
12
-
13
-
14
-
15
-
16
-
17
-
18
-
19
-
20
-
21
-
22
-
23
-
24
-
25
-
26
-
 27
27 -
 28
28 -
 29
29 -
 30
30 -
 31
31 -
 32
32 -
 33
33 -
 34
34 -
 35
35 -
 36
36 -
 37
37 -
 38
38 -
 39
39 -
 40
40 -
 41
41 -
 42
42 -
 43
43 -
 44
44 -
 45
45 -
 46
46 -
 47
47 -
48
-
49
-
50
-
51
-
52
-
53
-
54
-
55
-
56
-
57
-
58
-
59
-
60
-
61
-
62
-
63
-
64
-
65
-
66
-
67
-
68
-
69
-
70
-
71
-
72
-
73
-
74
-
75
-
76
-
77
-
78
-
79
-
80
-
81
-
82
-
83
-
84
-
85
-
86
-
87
-
88
-
89
-
90
-
91
-
92
-
93
-
94
-
95
-
96
-
97
-
98
-
99
-
100
-
101
-
102
-
103
-
104
-
105
-
106
-
107
-
108
-
109
-
110
-
111
-
112
-
113
-
114
-
115
-
116
-
117
-
118
-
119
-
120
-
121
-
122
-
123
-
124
-
125
-
126
-
127
-
128
-
129
-
130
-
131
-
132
-
133
-
134
-
135
-
136
-
137
-
138
-
139
-
140
-
141
-
142
-
143
-
144
-
145
-
146
-
147
-
148
-
149
-
150
-
151
-
152
-
153
-
154
-
155
-
156
-
157
-
158
-
159
-
160
-
161
-
162
-
163
-
164
-
165
-
166
-
167
-
168
-
169
-
170
-
171
-
172
-
173
-
174
-
175
-
176
-
177
-
178
-
179
-
180
-
181
-
182
-
183
-
184
-
185
-
186
-
187
-
188
-
189
-
190
-
191
-
192
-
193
-
194
-
195
-
196
-
197
-
198
-
199
-
200
-
201
-
202
-
203
-
204
-
205
-
206
-
207
-
208
-
209
-
210
-
211
-
212
-
213
-
214
-
215
-
216
-
217
-
218
-
219
-
220
-
221
-
222
-
223
-
224
-
225
-
226
-
227
-
228
-
229
-
230
-
231
-
232
-
233
-
234
-
235
-
236
-
237
-
238
-
239
-
240
-
241
-
242
-
243
-
244
-
245
-
246
-
247
-
248
-
249
-
250
-
251
-
252
-
253
-
254
-
255
-
256
-
257
-
258
-
259
-
260
-
261
-
262
-
263
-
264
-
265
-
266
-
267
-
268
-
269
-
270
-
271
-
272
-
273
-
274
-
275
-
276
-
277
-
278
-
279
-
280
-
281
-
282
-
283
-
284
-
285
-
286
-
287
-
288
-
289
-
290
-
291
-
292
-
293
 |
 |

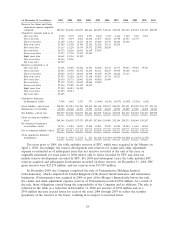
The gross and net cumulative deficiency (redundancy) by year as set forth in the table above
includes the following impact of unfavorable prior year reserve development related to asbestos and
environmental claims and claim adjustment expenses, in millions:
Asbestos 2001 2002 2003 2004 2005 2006 2007 2008 2009 2010
Gross ........................ $5,813 $2,153 $2,128 $1,742 $908 $711 $712 $642 $457 $195
Net ......................... $4,430 $1,485 $1,461 $1,557 $726 $570 $570 $500 $315 $175
Environmental 2001 2002 2003 2004 2005 2006 2007 2008 2009 2010
Gross ........................ $ 941 $ 787 $ 728 $ 602 $585 $477 $295 $210 $125 $ 80
Net ......................... $ 903 $ 753 $ 694 $ 601 $571 $451 $266 $181 $111 $ 76
Reserves on Statutory Accounting Basis
At December 31, 2011, 2010 and 2009, claims and claim adjustment expense reserves (net of
reinsurance) shown in the preceding table, which are prepared in accordance with U.S. generally
accepted accounting principles (GAAP reserves), were $20 million, $20 million and $18 million higher,
respectively, than those reported in the Company’s respective annual reports filed with insurance
regulators, which are prepared in accordance with statutory accounting practices (statutory reserves).
The differences between GAAP and statutory reserves are primarily due to the differences in
GAAP and statutory accounting for two items, (1) fees associated with billing of required
reimbursements under large deductible business, and (2) the accounting for retroactive reinsurance. For
large deductible business, the Company pays the deductible portion of a casualty insurance claim and
then seeks reimbursement from the insured, plus a fee. This fee is reported as fee income for GAAP
reporting, but as an offset to claim expenses paid for statutory reporting. Retroactive reinsurance
balances result from reinsurance placed to cover losses on insured events occurring prior to the
inception of a reinsurance contract. For GAAP reporting, retroactive reinsurance balances are included
in reinsurance recoverables and result in lower net reserve amounts. Statutory accounting practices
require retroactive reinsurance balances to be recorded in other liabilities as contra-liabilities rather
than in loss reserves.
Asbestos and Environmental Claims
Asbestos and environmental claims are segregated from other claims and are handled separately by
the Company’s Special Liability Group, a separate unit staffed by dedicated legal, claim, finance and
engineering professionals. For additional information on asbestos and environmental claims, see
‘‘Item 7—Management’s Discussion and Analysis of Financial Condition and Results of Operations—
Asbestos Claims and Litigation’’ and ‘‘—Environmental Claims and Litigation.’’
INTERCOMPANY REINSURANCE POOLING ARRANGEMENTS
Most of the Company’s insurance subsidiaries are members of an intercompany property and
casualty reinsurance pooling arrangement. Pooling arrangements permit the participating companies to
rely on the capacity of the entire pool’s policyholders’ surplus rather than just on its own policyholder
surplus. Under such arrangements, the members share substantially all insurance business that is
written and allocate the combined premiums, losses and expenses.
RATINGS
Ratings are an important factor in assessing the Company’s competitive position in the insurance
industry. The Company receives ratings from the following major rating agencies: A.M. Best Company
(A.M. Best), Fitch Ratings (Fitch), Moody’s Investors Service (Moody’s) and Standard & Poor’s Corp.
(S&P). Rating agencies typically issue two types of ratings for insurance companies: claims-paying (or
25