Travelers 2011 Annual Report Download - page 121
Download and view the complete annual report
Please find page 121 of the 2011 Travelers annual report below. You can navigate through the pages in the report by either clicking on the pages listed below, or by using the keyword search tool below to find specific information within the annual report.-
 1
1 -
2
-
3
-
4
-
5
-
6
-
7
-
8
-
9
-
10
-
11
-
12
-
13
-
14
-
15
-
16
-
17
-
18
-
19
-
20
-
21
-
22
-
23
-
24
-
25
-
26
-
27
-
28
-
29
-
30
-
31
-
32
-
33
-
34
-
35
-
36
-
37
-
38
-
39
-
40
-
41
-
42
-
43
-
44
-
45
-
46
-
47
-
48
-
49
-
50
-
51
-
52
-
53
-
54
-
55
-
56
-
57
-
58
-
59
-
60
-
61
-
62
-
63
-
64
-
65
-
66
-
67
-
68
-
69
-
70
-
71
-
72
-
73
-
74
-
75
-
76
-
77
-
78
-
79
-
80
-
81
-
82
-
83
-
84
-
85
-
86
-
87
-
88
-
89
-
90
-
91
-
92
-
93
-
94
-
95
-
96
-
97
-
98
-
99
-
100
-
101
-
102
-
103
-
104
-
105
-
106
-
107
-
108
-
109
-
110
-
 111
111 -
 112
112 -
 113
113 -
 114
114 -
 115
115 -
 116
116 -
 117
117 -
 118
118 -
 119
119 -
 120
120 -
 121
121 -
 122
122 -
 123
123 -
 124
124 -
 125
125 -
 126
126 -
 127
127 -
 128
128 -
 129
129 -
 130
130 -
 131
131 -
132
-
133
-
134
-
135
-
136
-
137
-
138
-
139
-
140
-
141
-
142
-
143
-
144
-
145
-
146
-
147
-
148
-
149
-
150
-
151
-
152
-
153
-
154
-
155
-
156
-
157
-
158
-
159
-
160
-
161
-
162
-
163
-
164
-
165
-
166
-
167
-
168
-
169
-
170
-
171
-
172
-
173
-
174
-
175
-
176
-
177
-
178
-
179
-
180
-
181
-
182
-
183
-
184
-
185
-
186
-
187
-
188
-
189
-
190
-
191
-
192
-
193
-
194
-
195
-
196
-
197
-
198
-
199
-
200
-
201
-
202
-
203
-
204
-
205
-
206
-
207
-
208
-
209
-
210
-
211
-
212
-
213
-
214
-
215
-
216
-
217
-
218
-
219
-
220
-
221
-
222
-
223
-
224
-
225
-
226
-
227
-
228
-
229
-
230
-
231
-
232
-
233
-
234
-
235
-
236
-
237
-
238
-
239
-
240
-
241
-
242
-
243
-
244
-
245
-
246
-
247
-
248
-
249
-
250
-
251
-
252
-
253
-
254
-
255
-
256
-
257
-
258
-
259
-
260
-
261
-
262
-
263
-
264
-
265
-
266
-
267
-
268
-
269
-
270
-
271
-
272
-
273
-
274
-
275
-
276
-
277
-
278
-
279
-
280
-
281
-
282
-
283
-
284
-
285
-
286
-
287
-
288
-
289
-
290
-
291
-
292
-
293
 |
 |

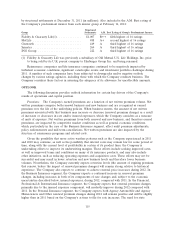
investment loss by length of time those securities have continuously been in an unrealized loss position
of greater than 20% of amortized cost:
Period For Which Fair Value Is Less Than 80% of Amortized Cost
Greater Than Greater Than
3 Months, 6 Months,
3 Months 6 Months 12 Months Greater Than
(in millions) or Less or Less or Less 12 Months Total
Fixed maturities:
Mortgage-backed securities ............ $ 2 $— $— $— $ 2
Other ........................... —56920
Total fixed maturities ............... 256922
Equity securities ..................... —————
Total .............................. $2 $5 $6 $9 $22
These unrealized investment losses at December 31, 2011 represent less than 1% of the combined
fixed maturity and equity security portfolios on a pretax basis and less than 1% of shareholders’ equity
on an after-tax basis.
For fixed maturity investments where fair value is less than the carrying value and the Company
did not reach a decision to impair, the Company continues to have the intent and ability to hold such
investments to a projected recovery in value, which may not be until maturity.
At December 31, 2011, below investment grade securities comprised 3.1% of the Company’s fixed
maturity investment portfolio. Included in below investment grade securities at December 31, 2011
were securities in an unrealized loss position that, in the aggregate, had an amortized cost of
$741 million and a fair value of $699 million, resulting in a net pretax unrealized investment loss of
$42 million. These securities in an unrealized loss position represented approximately 1% of both the
total amortized cost and the fair value of the fixed maturity portfolio at December 31, 2011 and
accounted for 47% of the total gross pretax unrealized investment loss in the fixed maturity portfolio at
December 31, 2011.
109