Travelers 2011 Annual Report Download - page 209
Download and view the complete annual report
Please find page 209 of the 2011 Travelers annual report below. You can navigate through the pages in the report by either clicking on the pages listed below, or by using the keyword search tool below to find specific information within the annual report.-
 1
1 -
2
-
3
-
4
-
5
-
6
-
7
-
8
-
9
-
10
-
11
-
12
-
13
-
14
-
15
-
16
-
17
-
18
-
19
-
20
-
21
-
22
-
23
-
24
-
25
-
26
-
27
-
28
-
29
-
30
-
31
-
32
-
33
-
34
-
35
-
36
-
37
-
38
-
39
-
40
-
41
-
42
-
43
-
44
-
45
-
46
-
47
-
48
-
49
-
50
-
51
-
52
-
53
-
54
-
55
-
56
-
57
-
58
-
59
-
60
-
61
-
62
-
63
-
64
-
65
-
66
-
67
-
68
-
69
-
70
-
71
-
72
-
73
-
74
-
75
-
76
-
77
-
78
-
79
-
80
-
81
-
82
-
83
-
84
-
85
-
86
-
87
-
88
-
89
-
90
-
91
-
92
-
93
-
94
-
95
-
96
-
97
-
98
-
99
-
100
-
101
-
102
-
103
-
104
-
105
-
106
-
107
-
108
-
109
-
110
-
111
-
112
-
113
-
114
-
115
-
116
-
117
-
118
-
119
-
120
-
121
-
122
-
123
-
124
-
125
-
126
-
127
-
128
-
129
-
130
-
131
-
132
-
133
-
134
-
135
-
136
-
137
-
138
-
139
-
140
-
141
-
142
-
143
-
144
-
145
-
146
-
147
-
148
-
149
-
150
-
151
-
152
-
153
-
154
-
155
-
156
-
157
-
158
-
159
-
160
-
161
-
162
-
163
-
164
-
165
-
166
-
167
-
168
-
169
-
170
-
171
-
172
-
173
-
174
-
175
-
176
-
177
-
178
-
179
-
180
-
181
-
182
-
183
-
184
-
185
-
186
-
187
-
188
-
189
-
190
-
191
-
192
-
193
-
194
-
195
-
196
-
197
-
198
-
 199
199 -
 200
200 -
 201
201 -
 202
202 -
 203
203 -
 204
204 -
 205
205 -
 206
206 -
 207
207 -
 208
208 -
 209
209 -
 210
210 -
 211
211 -
 212
212 -
 213
213 -
 214
214 -
 215
215 -
 216
216 -
 217
217 -
 218
218 -
 219
219 -
220
-
221
-
222
-
223
-
224
-
225
-
226
-
227
-
228
-
229
-
230
-
231
-
232
-
233
-
234
-
235
-
236
-
237
-
238
-
239
-
240
-
241
-
242
-
243
-
244
-
245
-
246
-
247
-
248
-
249
-
250
-
251
-
252
-
253
-
254
-
255
-
256
-
257
-
258
-
259
-
260
-
261
-
262
-
263
-
264
-
265
-
266
-
267
-
268
-
269
-
270
-
271
-
272
-
273
-
274
-
275
-
276
-
277
-
278
-
279
-
280
-
281
-
282
-
283
-
284
-
285
-
286
-
287
-
288
-
289
-
290
-
291
-
292
-
293
 |
 |

THE TRAVELERS COMPANIES, INC. AND SUBSIDIARIES
NOTES TO CONSOLIDATED FINANCIAL STATEMENTS (Continued)
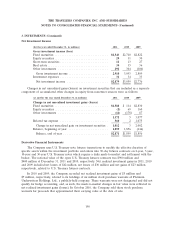
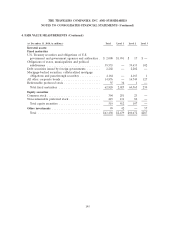
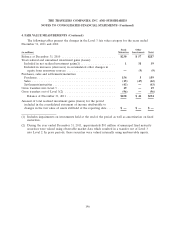
4. FAIR VALUE MEASUREMENTS (Continued)
Fixed Other
(in millions) Maturities Investments Total
Balance at December 31, 2009 .............................. $240 $154 $394
Total realized and unrealized investment gains (losses):
Included in net realized investment gains(1) ................... 5 2 7
Included in increases (decreases) in accumulated other changes in
equity from nonowner sources ........................... 10 11 21
Purchases, sales and settlements/maturities:
Purchases ............................................ 44 3 47
Sales ............................................... (9) (113) (122)
Settlements/maturities ................................... (41) — (41)
Gross transfers into Level 3 ................................ 13 — 13
Gross transfers out of Level 3 ............................... (32) — (32)
Balance at December 31, 2010 ........................... $230 $ 57 $287
Amount of total realized investment gains (losses) for the period
included in the consolidated statement of income attributable to
changes in the fair value of assets still held at the reporting date .... $ — $ — $ —
(1) Includes impairments on investments held at the end of the period as well as amortization on fixed
maturities.
The Company had no financial assets or financial liabilities that were measured at fair value on a
non-recurring basis during the years ended December 31, 2011 and 2010.
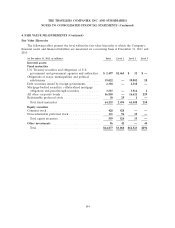
Financial Instruments Disclosed, But Not Carried, At Fair Value
The Company uses various financial instruments in the normal course of its business. The
Company’s insurance contracts are excluded from fair value of financial instruments accounting
guidance and, therefore, are not included in the amounts discussed below.
The carrying values of cash, short-term securities and investment income accrued approximated
their fair values.
The carrying values of $552 million and $647 million of financial instruments classified as other
assets approximated their fair values at December 31, 2011 and 2010, respectively. The carrying values
of $3.93 billion and $3.75 billion of financial instruments classified as other liabilities at December 31,
2011 and 2010, respectively, also approximated their fair values. Fair value is determined using various
methods including discounted cash flows, as appropriate for the various financial instruments.
The carrying value and fair value of the Company’s debt at December 31, 2011 was $6.61 billion
and $7.71 billion, respectively. The respective totals at December 31, 2010 were $6.61 billion and
$7.21 billion. The Company utilized a pricing service to estimate fair value measurements for
approximately 93% and 94% of its debt, other than commercial paper, at December 31, 2011 and 2010,
respectively. The pricing service utilizes market quotations for debt that have quoted prices in active
markets. For the small amount of the Company’s debt securities for which a pricing service is not used,
the Company utilizes pricing estimates from a nationally recognized broker/dealer to estimate fair
value. If estimates of fair value are unavailable from the pricing service or the broker/dealer, the
197