Travelers 2011 Annual Report Download - page 204
Download and view the complete annual report
Please find page 204 of the 2011 Travelers annual report below. You can navigate through the pages in the report by either clicking on the pages listed below, or by using the keyword search tool below to find specific information within the annual report.-
 1
1 -
2
-
3
-
4
-
5
-
6
-
7
-
8
-
9
-
10
-
11
-
12
-
13
-
14
-
15
-
16
-
17
-
18
-
19
-
20
-
21
-
22
-
23
-
24
-
25
-
26
-
27
-
28
-
29
-
30
-
31
-
32
-
33
-
34
-
35
-
36
-
37
-
38
-
39
-
40
-
41
-
42
-
43
-
44
-
45
-
46
-
47
-
48
-
49
-
50
-
51
-
52
-
53
-
54
-
55
-
56
-
57
-
58
-
59
-
60
-
61
-
62
-
63
-
64
-
65
-
66
-
67
-
68
-
69
-
70
-
71
-
72
-
73
-
74
-
75
-
76
-
77
-
78
-
79
-
80
-
81
-
82
-
83
-
84
-
85
-
86
-
87
-
88
-
89
-
90
-
91
-
92
-
93
-
94
-
95
-
96
-
97
-
98
-
99
-
100
-
101
-
102
-
103
-
104
-
105
-
106
-
107
-
108
-
109
-
110
-
111
-
112
-
113
-
114
-
115
-
116
-
117
-
118
-
119
-
120
-
121
-
122
-
123
-
124
-
125
-
126
-
127
-
128
-
129
-
130
-
131
-
132
-
133
-
134
-
135
-
136
-
137
-
138
-
139
-
140
-
141
-
142
-
143
-
144
-
145
-
146
-
147
-
148
-
149
-
150
-
151
-
152
-
153
-
154
-
155
-
156
-
157
-
158
-
159
-
160
-
161
-
162
-
163
-
164
-
165
-
166
-
167
-
168
-
169
-
170
-
171
-
172
-
173
-
174
-
175
-
176
-
177
-
178
-
179
-
180
-
181
-
182
-
183
-
184
-
185
-
186
-
187
-
188
-
189
-
190
-
191
-
192
-
193
-
 194
194 -
 195
195 -
 196
196 -
 197
197 -
 198
198 -
 199
199 -
 200
200 -
 201
201 -
 202
202 -
 203
203 -
 204
204 -
 205
205 -
 206
206 -
 207
207 -
 208
208 -
 209
209 -
 210
210 -
 211
211 -
 212
212 -
 213
213 -
 214
214 -
215
-
216
-
217
-
218
-
219
-
220
-
221
-
222
-
223
-
224
-
225
-
226
-
227
-
228
-
229
-
230
-
231
-
232
-
233
-
234
-
235
-
236
-
237
-
238
-
239
-
240
-
241
-
242
-
243
-
244
-
245
-
246
-
247
-
248
-
249
-
250
-
251
-
252
-
253
-
254
-
255
-
256
-
257
-
258
-
259
-
260
-
261
-
262
-
263
-
264
-
265
-
266
-
267
-
268
-
269
-
270
-
271
-
272
-
273
-
274
-
275
-
276
-
277
-
278
-
279
-
280
-
281
-
282
-
283
-
284
-
285
-
286
-
287
-
288
-
289
-
290
-
291
-
292
-
293
 |
 |
THE TRAVELERS COMPANIES, INC. AND SUBSIDIARIES
NOTES TO CONSOLIDATED FINANCIAL STATEMENTS (Continued)
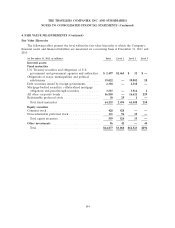
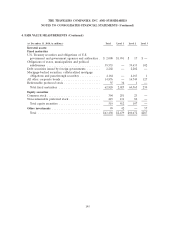
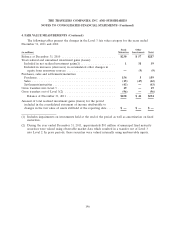
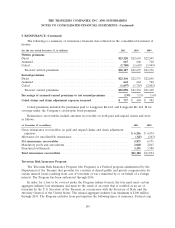
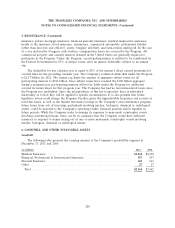
4. FAIR VALUE MEASUREMENTS (Continued)
maturity investments. The fair value estimates provided from this pricing service are included in the
amount disclosed in Level 2 of the hierarchy. If quoted market prices and an estimate from a pricing
service are unavailable, the Company produces an estimate of fair value based on internally developed
valuation techniques, which, depending on the level of observable market inputs, will render the fair
value estimate as Level 2 or Level 3. The Company bases all of its estimates of fair value for assets on
the bid price as it represents what a third-party market participant would be willing to pay in an arm’s
length transaction.
Fixed Maturities
The Company utilizes a pricing service to estimate fair value measurements for approximately 98%
of its fixed maturities. The pricing service utilizes market quotations for fixed maturity securities that
have quoted prices in active markets. Since fixed maturities other than U.S. Treasury securities
generally do not trade on a daily basis, the pricing service prepares estimates of fair value
measurements for these securities using its proprietary pricing applications, which include available
relevant market information, benchmark curves, benchmarking of like securities, sector groupings and
matrix pricing. Additionally, the pricing service uses an Option Adjusted Spread model to develop
prepayment and interest rate scenarios.
The pricing service evaluates each asset class based on relevant market information, relevant credit
information, perceived market movements and sector news. The market inputs utilized in the pricing
evaluation, listed in the approximate order of priority, include: benchmark yields, reported trades,
broker/dealer quotes, issuer spreads, two-sided markets, benchmark securities, bids, offers, reference
data, and industry and economic events. The extent of the use of each market input depends on the
asset class and the market conditions. Depending on the security, the priority of the use of inputs may
change or some market inputs may not be relevant. For some securities, additional inputs may be
necessary.
The pricing service utilized by the Company has indicated that they will only produce an estimate
of fair value if there is objectively verifiable information to produce a valuation. If the pricing service
discontinues pricing an investment, the Company would be required to produce an estimate of fair
value using some of the same methodologies as the pricing service but would have to make
assumptions for market-based inputs that are unavailable due to market conditions.
The fair value estimates of most fixed maturity investments are based on observable market
information rather than market quotes. Accordingly, the estimates of fair value for such fixed
maturities, other than U.S. Treasury securities, provided by the pricing service are included in the
amount disclosed in Level 2 of the hierarchy. The estimated fair value of U.S. Treasury securities is
included in the amount disclosed in Level 1 as the estimates are based on unadjusted market prices.
The Company also holds certain fixed maturity investments which are not priced by the pricing
service and estimates the fair value of such fixed maturities using an internal matrix that is based on
market information regarding interest rates, credit spreads and liquidity. The underlying source data for
calculating the matrix of credit spreads relative to the U.S. Treasury curve are the BofA Merrill Lynch
U.S. Corporate Index and the BofA Merrill Lynch High Yield BB Rated Index. The Company includes
the fair value estimates of these corporate bonds in Level 2, since all significant inputs are market
observable.
192