Travelers 2011 Annual Report Download - page 122
Download and view the complete annual report
Please find page 122 of the 2011 Travelers annual report below. You can navigate through the pages in the report by either clicking on the pages listed below, or by using the keyword search tool below to find specific information within the annual report.-
 1
1 -
2
-
3
-
4
-
5
-
6
-
7
-
8
-
9
-
10
-
11
-
12
-
13
-
14
-
15
-
16
-
17
-
18
-
19
-
20
-
21
-
22
-
23
-
24
-
25
-
26
-
27
-
28
-
29
-
30
-
31
-
32
-
33
-
34
-
35
-
36
-
37
-
38
-
39
-
40
-
41
-
42
-
43
-
44
-
45
-
46
-
47
-
48
-
49
-
50
-
51
-
52
-
53
-
54
-
55
-
56
-
57
-
58
-
59
-
60
-
61
-
62
-
63
-
64
-
65
-
66
-
67
-
68
-
69
-
70
-
71
-
72
-
73
-
74
-
75
-
76
-
77
-
78
-
79
-
80
-
81
-
82
-
83
-
84
-
85
-
86
-
87
-
88
-
89
-
90
-
91
-
92
-
93
-
94
-
95
-
96
-
97
-
98
-
99
-
100
-
101
-
102
-
103
-
104
-
105
-
106
-
107
-
108
-
109
-
110
-
111
-
 112
112 -
 113
113 -
 114
114 -
 115
115 -
 116
116 -
 117
117 -
 118
118 -
 119
119 -
 120
120 -
 121
121 -
 122
122 -
 123
123 -
 124
124 -
 125
125 -
 126
126 -
 127
127 -
 128
128 -
 129
129 -
 130
130 -
 131
131 -
 132
132 -
133
-
134
-
135
-
136
-
137
-
138
-
139
-
140
-
141
-
142
-
143
-
144
-
145
-
146
-
147
-
148
-
149
-
150
-
151
-
152
-
153
-
154
-
155
-
156
-
157
-
158
-
159
-
160
-
161
-
162
-
163
-
164
-
165
-
166
-
167
-
168
-
169
-
170
-
171
-
172
-
173
-
174
-
175
-
176
-
177
-
178
-
179
-
180
-
181
-
182
-
183
-
184
-
185
-
186
-
187
-
188
-
189
-
190
-
191
-
192
-
193
-
194
-
195
-
196
-
197
-
198
-
199
-
200
-
201
-
202
-
203
-
204
-
205
-
206
-
207
-
208
-
209
-
210
-
211
-
212
-
213
-
214
-
215
-
216
-
217
-
218
-
219
-
220
-
221
-
222
-
223
-
224
-
225
-
226
-
227
-
228
-
229
-
230
-
231
-
232
-
233
-
234
-
235
-
236
-
237
-
238
-
239
-
240
-
241
-
242
-
243
-
244
-
245
-
246
-
247
-
248
-
249
-
250
-
251
-
252
-
253
-
254
-
255
-
256
-
257
-
258
-
259
-
260
-
261
-
262
-
263
-
264
-
265
-
266
-
267
-
268
-
269
-
270
-
271
-
272
-
273
-
274
-
275
-
276
-
277
-
278
-
279
-
280
-
281
-
282
-
283
-
284
-
285
-
286
-
287
-
288
-
289
-
290
-
291
-
292
-
293
 |
 |

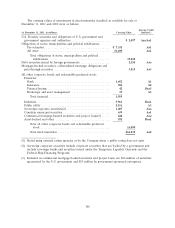
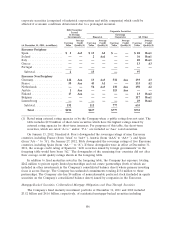
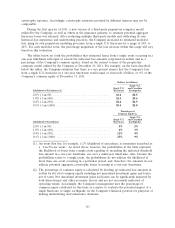
Impairment Charges
Impairment charges included in net realized investment gains in the consolidated statement of
income were as follows:
(for the year ended December 31, in millions) 2011 2010 2009
Fixed maturities
U.S. Treasury securities and obligations of U.S. government
and government agencies and authorities ............... $— $— $ —
Obligations of states, municipalities and political subdivisions . . ———
Debt securities issued by foreign governments ............. ———
Mortgage-backed securities, collateralized mortgage obligations
and pass-through securities ......................... 13 481
All other corporate bonds ........................... 5988
Redeemable preferred stock .......................... ———
Total fixed maturities ............................. 18 13 169
Equity securities
Common stock ................................... 6215
Non-redeemable preferred stock ...................... —164
Total equity securities ............................. 6379
Other investments .................................. 110 10
Total ......................................... $25 $26 $258
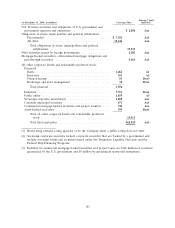
Investment impairments in 2011 and 2010 were not significant. In 2009, worldwide financial
markets experienced significant disruptions, and the United States and many other countries
experienced an economic downturn, resulting in heightened credit risks, reduced valuations of
investments and decreased economic activity. Those factors resulted in the higher level of
other-than-temporary investment impairments recognized by the Company in 2009.
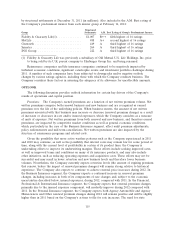
Following are the pretax realized losses on investments sold during the year ended December 31,
2011:
(for the year ended December 31, in millions) Loss Fair Value
Fixed maturities ...................................... $10 $214
Equity securities ...................................... 234
Other .............................................. 12
Total .............................................. $13 $250
Purchases and sales of investments are based on cash requirements, the characteristics of the
insurance liabilities and current market conditions. The Company identifies investments to be sold to
achieve its primary investment goals of assuring the Company’s ability to meet policyholder obligations
as well as to optimize investment returns, given these obligations.
CATASTROPHE MODELING
The Company uses various analyses and methods, including computer modeling processes, to
analyze catastrophic events and the risks associated with them. The Company uses these analyses and
methods to make underwriting and reinsurance decisions designed to manage its exposure to
catastrophic events. There are no industry-standard methodologies or assumptions for projecting
110