Travelers 2011 Annual Report Download - page 101
Download and view the complete annual report
Please find page 101 of the 2011 Travelers annual report below. You can navigate through the pages in the report by either clicking on the pages listed below, or by using the keyword search tool below to find specific information within the annual report.-
 1
1 -
2
-
3
-
4
-
5
-
6
-
7
-
8
-
9
-
10
-
11
-
12
-
13
-
14
-
15
-
16
-
17
-
18
-
19
-
20
-
21
-
22
-
23
-
24
-
25
-
26
-
27
-
28
-
29
-
30
-
31
-
32
-
33
-
34
-
35
-
36
-
37
-
38
-
39
-
40
-
41
-
42
-
43
-
44
-
45
-
46
-
47
-
48
-
49
-
50
-
51
-
52
-
53
-
54
-
55
-
56
-
57
-
58
-
59
-
60
-
61
-
62
-
63
-
64
-
65
-
66
-
67
-
68
-
69
-
70
-
71
-
72
-
73
-
74
-
75
-
76
-
77
-
78
-
79
-
80
-
81
-
82
-
83
-
84
-
85
-
86
-
87
-
88
-
89
-
90
-
 91
91 -
 92
92 -
 93
93 -
 94
94 -
 95
95 -
 96
96 -
 97
97 -
 98
98 -
 99
99 -
 100
100 -
 101
101 -
 102
102 -
 103
103 -
 104
104 -
 105
105 -
 106
106 -
 107
107 -
 108
108 -
 109
109 -
 110
110 -
 111
111 -
112
-
113
-
114
-
115
-
116
-
117
-
118
-
119
-
120
-
121
-
122
-
123
-
124
-
125
-
126
-
127
-
128
-
129
-
130
-
131
-
132
-
133
-
134
-
135
-
136
-
137
-
138
-
139
-
140
-
141
-
142
-
143
-
144
-
145
-
146
-
147
-
148
-
149
-
150
-
151
-
152
-
153
-
154
-
155
-
156
-
157
-
158
-
159
-
160
-
161
-
162
-
163
-
164
-
165
-
166
-
167
-
168
-
169
-
170
-
171
-
172
-
173
-
174
-
175
-
176
-
177
-
178
-
179
-
180
-
181
-
182
-
183
-
184
-
185
-
186
-
187
-
188
-
189
-
190
-
191
-
192
-
193
-
194
-
195
-
196
-
197
-
198
-
199
-
200
-
201
-
202
-
203
-
204
-
205
-
206
-
207
-
208
-
209
-
210
-
211
-
212
-
213
-
214
-
215
-
216
-
217
-
218
-
219
-
220
-
221
-
222
-
223
-
224
-
225
-
226
-
227
-
228
-
229
-
230
-
231
-
232
-
233
-
234
-
235
-
236
-
237
-
238
-
239
-
240
-
241
-
242
-
243
-
244
-
245
-
246
-
247
-
248
-
249
-
250
-
251
-
252
-
253
-
254
-
255
-
256
-
257
-
258
-
259
-
260
-
261
-
262
-
263
-
264
-
265
-
266
-
267
-
268
-
269
-
270
-
271
-
272
-
273
-
274
-
275
-
276
-
277
-
278
-
279
-
280
-
281
-
282
-
283
-
284
-
285
-
286
-
287
-
288
-
289
-
290
-
291
-
292
-
293
 |
 |
volume, the favorable impact of earned pricing and loss cost trends, as well as a reduction in
non-catastrophe weather-related losses. In addition, operating income in 2009 included a $48 million
reduction in the estimate of property windpool assessments related to Hurricane Ike that had been
recorded in general and administrative expenses in 2008. Catastrophe losses in 2010 and 2009 were
$594 million and $278 million, respectively. Net favorable prior year reserve development in 2010 and
2009 was $87 million and $135 million, respectively.
Revenues
Earned Premiums
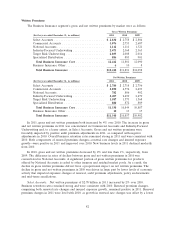
Earned premiums of $7.59 billion in 2011 were $240 million, or 3%, higher than in 2010. Earned
premiums of $7.35 billion in 2010 were $232 million, or 3%, higher than in 2009. The increases in both
years primarily reflected an increase in net written premiums over the preceding twelve months.
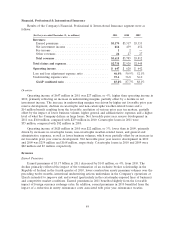
Net Investment Income
Net investment income of $424 million in 2011 decreased by $40 million, or 9%, from 2010. In
2010, net investment income of $464 million increased by $42 million, or 10%, over 2009. Refer to the
‘‘Net Investment Income’’ section of ‘‘Consolidated Results of Operations’’ herein for a discussion of
the change in the Company’s net investment income in 2011 and 2010 as compared with the respective
prior year. In addition, refer to note 2 of notes to the Company’s consolidated financial statements for
a discussion of the Company’s net investment income allocation methodology.
Claims and Expenses
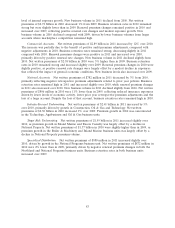
Claims and Claim Adjustment Expenses
Claims and claim adjustment expenses of $6.34 billion in 2011 were $1.34 billion, or 27%, higher
than in 2010. The increase primarily reflected the significant increase in catastrophe losses, along with
the impact of loss cost trends, higher than expected non-catastrophe weather-related losses and higher
business volumes. These factors were partially offset by an increase in net favorable prior year reserve
development. Catastrophe losses in 2011 and 2010 were $1.49 billion and $594 million, respectively.
Catastrophe losses in 2011 included the impact of multiple tornadoes and hail storms, primarily in the
Midwest and Southeast regions of the United States, as well as Hurricane Irene. Catastrophe losses in
2010 resulted from several severe wind and hail storms. Net favorable prior year reserve development
in 2011 and 2010 was $110 million and $87 million, respectively. The 2011 total was driven by better
than expected loss development related to catastrophe losses incurred in the first half of 2010, as well
as better than expected loss development in the 2006-2010 accident years for the umbrella line of
business in the Homeowners and Other product line, partially offset by worse than expected loss
development in the Automobile product line for the 2007-2010 accident years.
Claims and claim adjustment expenses in 2010 were $5.01 billion, $382 million, or 8%, higher than
in 2009. The total in 2010 reflected the significant increase in catastrophe losses, the reduction in net
favorable prior year reserve development and increased business volume, partially offset by a decline in
non-catastrophe weather-related losses and improved loss cost trends. Catastrophe losses in 2010 and
2009 were $594 million and $278 million, respectively. Catastrophe losses in 2009 primarily resulted
from several wind and hail storms, as well as flooding. Net favorable prior year reserve development in
2010 and 2009 was $87 million and $135 million, respectively. Net favorable prior year reserve
development in 2010 was concentrated in the Homeowners and Other product line, primarily driven by
favorable loss development in the 2008 and prior accident years, primarily for the umbrella line of
business, partially offset by unfavorable loss development in the 2009 accident year for the homeowners
line of business that was driven by higher than anticipated late-reported claims related to storms in
89