Travelers 2011 Annual Report Download - page 91
Download and view the complete annual report
Please find page 91 of the 2011 Travelers annual report below. You can navigate through the pages in the report by either clicking on the pages listed below, or by using the keyword search tool below to find specific information within the annual report.-
 1
1 -
2
-
3
-
4
-
5
-
6
-
7
-
8
-
9
-
10
-
11
-
12
-
13
-
14
-
15
-
16
-
17
-
18
-
19
-
20
-
21
-
22
-
23
-
24
-
25
-
26
-
27
-
28
-
29
-
30
-
31
-
32
-
33
-
34
-
35
-
36
-
37
-
38
-
39
-
40
-
41
-
42
-
43
-
44
-
45
-
46
-
47
-
48
-
49
-
50
-
51
-
52
-
53
-
54
-
55
-
56
-
57
-
58
-
59
-
60
-
61
-
62
-
63
-
64
-
65
-
66
-
67
-
68
-
69
-
70
-
71
-
72
-
73
-
74
-
75
-
76
-
77
-
78
-
79
-
80
-
 81
81 -
 82
82 -
 83
83 -
 84
84 -
 85
85 -
 86
86 -
 87
87 -
 88
88 -
 89
89 -
 90
90 -
 91
91 -
 92
92 -
 93
93 -
 94
94 -
 95
95 -
 96
96 -
 97
97 -
 98
98 -
 99
99 -
 100
100 -
 101
101 -
102
-
103
-
104
-
105
-
106
-
107
-
108
-
109
-
110
-
111
-
112
-
113
-
114
-
115
-
116
-
117
-
118
-
119
-
120
-
121
-
122
-
123
-
124
-
125
-
126
-
127
-
128
-
129
-
130
-
131
-
132
-
133
-
134
-
135
-
136
-
137
-
138
-
139
-
140
-
141
-
142
-
143
-
144
-
145
-
146
-
147
-
148
-
149
-
150
-
151
-
152
-
153
-
154
-
155
-
156
-
157
-
158
-
159
-
160
-
161
-
162
-
163
-
164
-
165
-
166
-
167
-
168
-
169
-
170
-
171
-
172
-
173
-
174
-
175
-
176
-
177
-
178
-
179
-
180
-
181
-
182
-
183
-
184
-
185
-
186
-
187
-
188
-
189
-
190
-
191
-
192
-
193
-
194
-
195
-
196
-
197
-
198
-
199
-
200
-
201
-
202
-
203
-
204
-
205
-
206
-
207
-
208
-
209
-
210
-
211
-
212
-
213
-
214
-
215
-
216
-
217
-
218
-
219
-
220
-
221
-
222
-
223
-
224
-
225
-
226
-
227
-
228
-
229
-
230
-
231
-
232
-
233
-
234
-
235
-
236
-
237
-
238
-
239
-
240
-
241
-
242
-
243
-
244
-
245
-
246
-
247
-
248
-
249
-
250
-
251
-
252
-
253
-
254
-
255
-
256
-
257
-
258
-
259
-
260
-
261
-
262
-
263
-
264
-
265
-
266
-
267
-
268
-
269
-
270
-
271
-
272
-
273
-
274
-
275
-
276
-
277
-
278
-
279
-
280
-
281
-
282
-
283
-
284
-
285
-
286
-
287
-
288
-
289
-
290
-
291
-
292
-
293
 |
 |
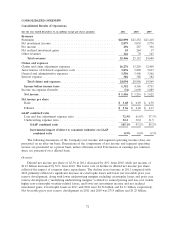
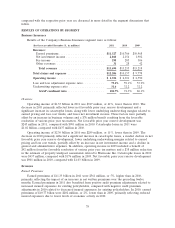
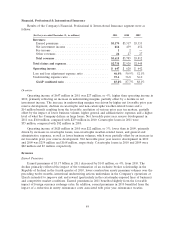
Net Investment Income
Net investment income of $2.04 billion in 2011 was $115 million, or 5%, lower than in 2010. In
2010, net investment income of $2.16 billion was $254 million, or 13% higher than in 2009. Refer to
the ‘‘Net Investment Income’’ section of ‘‘Consolidated Results of Operations’’ herein for a discussion
of the changes in the Company’s net investment income in 2011 and 2010 as compared with the
respective prior year. In addition, refer to note 2 of notes to the Company’s consolidated financial
statements herein for a discussion of the Company’s net investment income allocation methodology.
Fee Income
National Accounts is the primary source of fee income due to its service businesses, which include
claim and loss prevention services to large companies that choose to self-insure a portion of their
insurance risks, as well as claims and policy management services to workers’ compensation residual
market pools. Fee income in 2011 increased by $10 million, or 4%, over 2010, driven by strong business
retention rates coupled with higher serviced premium and claim volume in workers’ compensation
residual market pools. In 2010, fee income decreased $21 million, or 7%, from 2009, primarily
reflecting lower new business volume due to lower levels of economic activity and lower serviced
premium and claim volume due to the de-population of workers’ compensation residual market pools.
The decline in 2010 also reflected the impact of both lower claim volume and lower loss costs (as fees
are based either on the number of claims serviced or as a percentage of losses) driven by workers’
compensation reforms, as well as overall lower claim frequency and increased competition.
Claims and Expenses
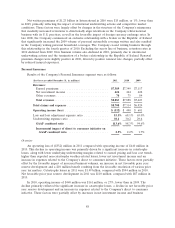
Claims and Claim Adjustment Expenses
Claims and claim adjustment expenses in 2011 were $8.45 billion, $1.94 billion, or 30%, higher
than in 2010. The increase in 2011 primarily reflected a significant decline in net favorable prior year
reserve development and a significant increase in catastrophe losses, along with the impact of loss cost
trends that included slightly higher than expected loss costs in the workers’ compensation and
commercial auto product lines. Net favorable prior year reserve development in 2011 was $245 million,
compared with $901 million in 2010. Net favorable prior year reserve development in 2011 was
primarily driven by better than expected loss development in the general liability product line
(excluding increases to asbestos and environmental reserves discussed below), which was concentrated
in excess coverages for accident years 2005-2008 and reflected what the Company believes are more
favorable legal and judicial environments than what the Company previously expected, as well as better
than expected loss development for the 2008 and 2009 accident years in the property product line. The
workers’ compensation line of business contributed slightly to net favorable prior year reserve
development in 2011, as favorable reserve development for the 2003-2009 accident years was largely
offset by net unfavorable reserve development for the 2010 accident year related to higher than
expected loss frequency. These factors were partially offset by $175 million and $76 million increases to
asbestos and environmental reserves in 2011, respectively (discussed in further detail in the ‘‘Asbestos
Claims and Litigation’’ and ‘‘Environmental Claims and Litigation’’ sections herein), unfavorable prior
year reserve development in the commercial multi-peril product line driven by higher than expected
late reported hail claims from 2010 and unfavorable prior year reserve development in the commercial
automobile product line that reflected worse than expected severity for the 2009-2010 accident years.
Catastrophe losses in 2011 were $1.02 billion, compared with $437 million in 2010. Catastrophe losses
in 2011 primarily resulted from winter storms and severe wind and hail storms throughout the United
States, as well as Hurricane Irene.
Claims and claim adjustment expenses in 2010 were $6.50 billion, $467 million, or 8%, higher than
in 2009. The increase in 2010 primarily reflected a significant increase in catastrophe losses, a modest
79