Travelers 2011 Annual Report Download - page 134
Download and view the complete annual report
Please find page 134 of the 2011 Travelers annual report below. You can navigate through the pages in the report by either clicking on the pages listed below, or by using the keyword search tool below to find specific information within the annual report.-
 1
1 -
2
-
3
-
4
-
5
-
6
-
7
-
8
-
9
-
10
-
11
-
12
-
13
-
14
-
15
-
16
-
17
-
18
-
19
-
20
-
21
-
22
-
23
-
24
-
25
-
26
-
27
-
28
-
29
-
30
-
31
-
32
-
33
-
34
-
35
-
36
-
37
-
38
-
39
-
40
-
41
-
42
-
43
-
44
-
45
-
46
-
47
-
48
-
49
-
50
-
51
-
52
-
53
-
54
-
55
-
56
-
57
-
58
-
59
-
60
-
61
-
62
-
63
-
64
-
65
-
66
-
67
-
68
-
69
-
70
-
71
-
72
-
73
-
74
-
75
-
76
-
77
-
78
-
79
-
80
-
81
-
82
-
83
-
84
-
85
-
86
-
87
-
88
-
89
-
90
-
91
-
92
-
93
-
94
-
95
-
96
-
97
-
98
-
99
-
100
-
101
-
102
-
103
-
104
-
105
-
106
-
107
-
108
-
109
-
110
-
111
-
112
-
113
-
114
-
115
-
116
-
117
-
118
-
119
-
120
-
121
-
122
-
123
-
 124
124 -
 125
125 -
 126
126 -
 127
127 -
 128
128 -
 129
129 -
 130
130 -
 131
131 -
 132
132 -
 133
133 -
 134
134 -
 135
135 -
 136
136 -
 137
137 -
 138
138 -
 139
139 -
 140
140 -
 141
141 -
 142
142 -
 143
143 -
 144
144 -
145
-
146
-
147
-
148
-
149
-
150
-
151
-
152
-
153
-
154
-
155
-
156
-
157
-
158
-
159
-
160
-
161
-
162
-
163
-
164
-
165
-
166
-
167
-
168
-
169
-
170
-
171
-
172
-
173
-
174
-
175
-
176
-
177
-
178
-
179
-
180
-
181
-
182
-
183
-
184
-
185
-
186
-
187
-
188
-
189
-
190
-
191
-
192
-
193
-
194
-
195
-
196
-
197
-
198
-
199
-
200
-
201
-
202
-
203
-
204
-
205
-
206
-
207
-
208
-
209
-
210
-
211
-
212
-
213
-
214
-
215
-
216
-
217
-
218
-
219
-
220
-
221
-
222
-
223
-
224
-
225
-
226
-
227
-
228
-
229
-
230
-
231
-
232
-
233
-
234
-
235
-
236
-
237
-
238
-
239
-
240
-
241
-
242
-
243
-
244
-
245
-
246
-
247
-
248
-
249
-
250
-
251
-
252
-
253
-
254
-
255
-
256
-
257
-
258
-
259
-
260
-
261
-
262
-
263
-
264
-
265
-
266
-
267
-
268
-
269
-
270
-
271
-
272
-
273
-
274
-
275
-
276
-
277
-
278
-
279
-
280
-
281
-
282
-
283
-
284
-
285
-
286
-
287
-
288
-
289
-
290
-
291
-
292
-
293
 |
 |

From the inception of the first authorization in May 2006 through December 31, 2011, the
Company repurchased a cumulative total of 340.0 million shares for a total cost of $17.39 billion, or an
average of $51.16 per share.
In 2011, 2010 and 2009, the Company acquired 1.4 million, 1.3 million and 1.5 million shares,
respectively, of common stock from employees as treasury stock primarily to cover payroll withholding
taxes related to the vesting of restricted stock awards and exercises of stock options.
Conversion of Preferred Stock to Common Stock. In May 2011, the Company’s board of directors
authorized the redemption of the Company’s preferred stock held by The Travelers 401(k) Savings Plan
(the Savings Plan) and gave notice of that redemption to the appropriate fiduciaries of the Savings
Plan. Following a fiduciary review, the Savings Plan exercised its right to convert each preferred share
into eight shares of the Company’s common stock. As a result, all preferred shares outstanding on
June 7, 2011 (190,083 shares) were converted into a total of 1.52 million shares of the Company’s
common stock.
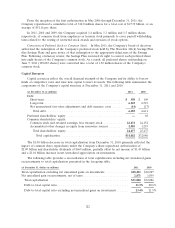
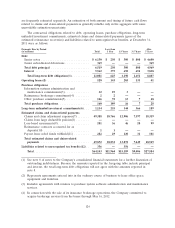
Capital Resources
Capital resources reflect the overall financial strength of the Company and its ability to borrow
funds at competitive rates and raise new capital to meet its needs. The following table summarizes the
components of the Company’s capital structure at December 31, 2011 and 2010.
(at December 31, in millions) 2011 2010
Debt:
Short-term ............................................. $ 350 $ 109
Long-term ............................................. 6,269 6,519
Net unamortized fair value adjustments and debt issuance costs ...... (14) (17)
Total debt ............................................ 6,605 6,611
Preferred shareholders’ equity ................................ —68
Common shareholders’ equity:
Common stock and retained earnings, less treasury stock ........... 22,472 24,152
Accumulated other changes in equity from nonowner sources ........ 2,005 1,255
Total shareholders’ equity ................................ 24,477 25,475
Total capitalization .................................... $31,082 $32,086
The $1.00 billion decrease in total capitalization from December 31, 2010 primarily reflected the
impact of common share repurchases under the Company’s share repurchase authorization of
$2.90 billion and shareholder dividends of $669 million, partially offset by net income of $1.43 billion
and a $1.01 billion increase in net unrealized appreciation on investments.
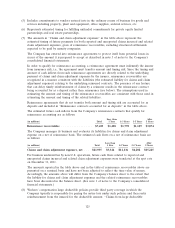
The following table provides a reconciliation of total capitalization excluding net unrealized gains
on investments to total capitalization presented in the foregoing table.
(at December 31, dollars in millions) 2011 2010
Total capitalization excluding net unrealized gains on investments ............. $28,211 $30,227
Net unrealized gain on investments, net of taxes .......................... 2,871 1,859
Total capitalization .............................................. $31,082 $32,086
Debt-to-total capital ratio ......................................... 21.3% 20.6%
Debt-to-total capital ratio excluding net unrealized gains on investments ....... 23.4% 21.9%
122